Prometheus环境搭建
本文是Prometheus环境的搭建和安装,包括prometheus-sever、node-exporter、grafna的安装。安装成功后,配置prometheus采集node-exporter的指标,然后在grafana展示node-exporter采集的指标。
安装prometheus
去prometheus官网下载prometheus,下载地址为https://prometheus.io/download/ ,目前提供了Linux\windows\mac的版本,笔者这里下载mac版本的。
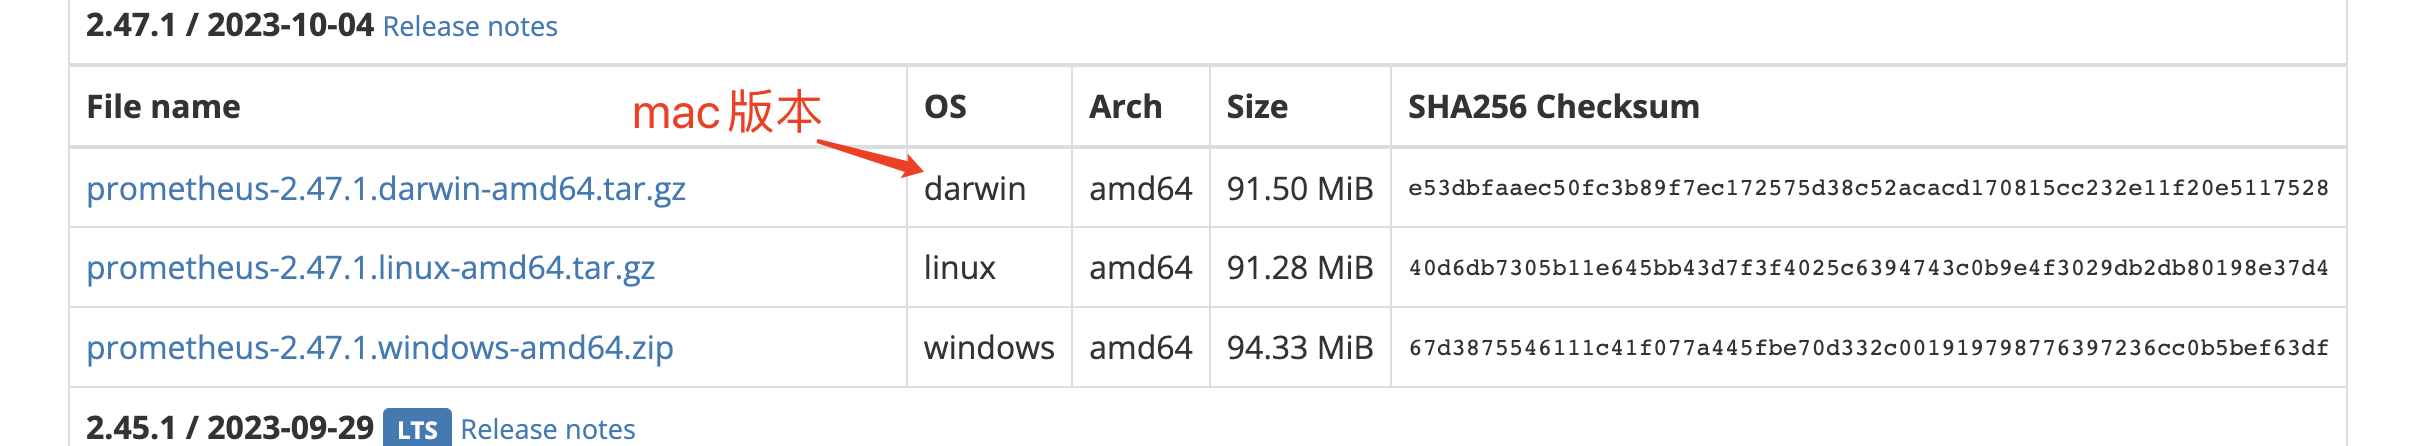
下载完成后,执行解压:
tar -zxvf prometheus-2.47.1.darwin-amd64.tar.gz
cd prometheus-2.47.1.darwin-amd64
执行启动命令:
./prometheus
笔者是mac电脑,运行时会被系统拒绝运行,需要打开系统偏好设置-安全与隐私,允许prometheus运行。
其他操作系统应该没有这个问题。
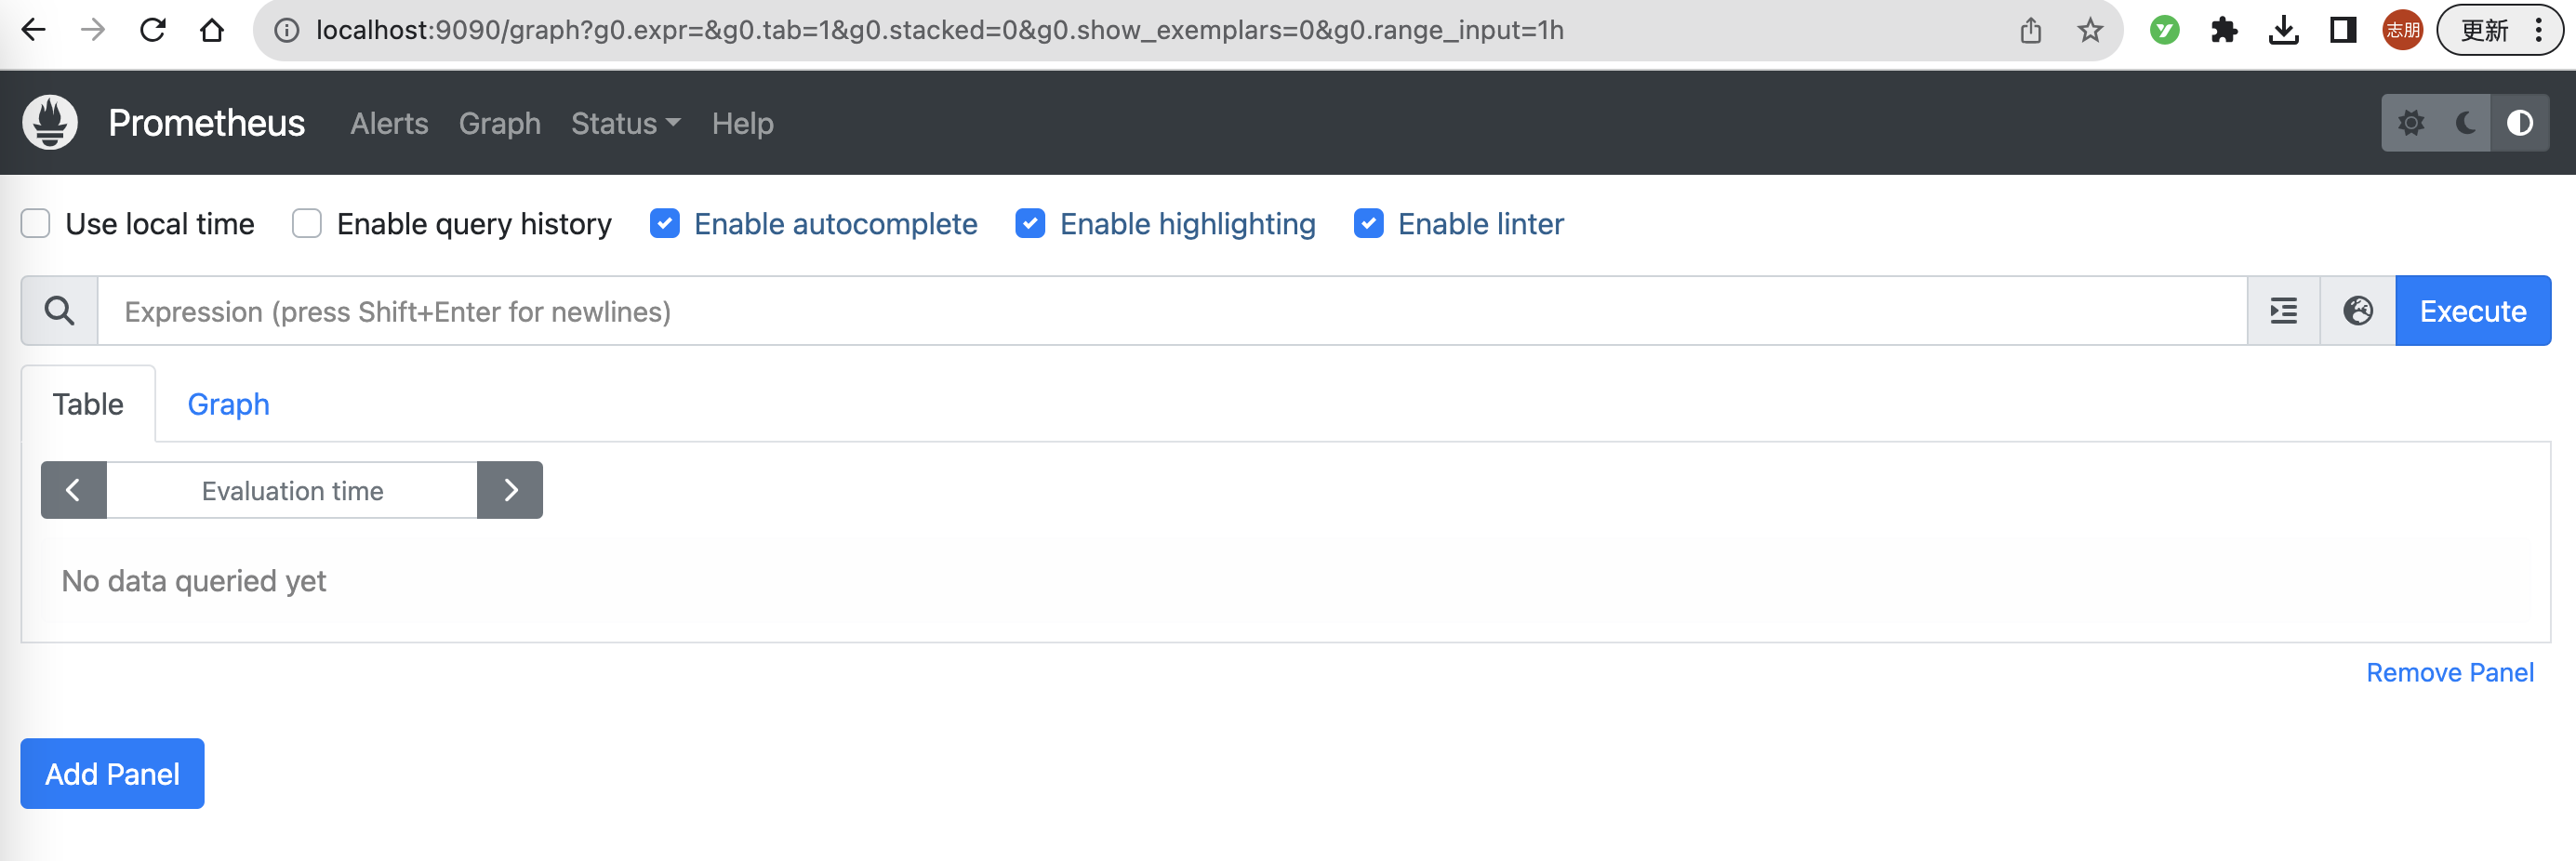
启动成功后,访问http://localhost:9090 ,就可以访问prometheus页面了,这个页面提供了对prometheus数据的查询和告警信息的查询,页面展示如下:
prometheus配置文件讲解
在prometheus启动文件同级的目录下面有一个配置文件prometheus.yml,这个配置文件是prometheus启动的时候会读取的配置。具体如下:
# my global config
global:
  scrape_interval: 15s
  evaluation_interval: 15s

# Alertmanager configuration
alerting:
  alertmanagers:
    - static_configs:
        - targets:
          # - alertmanager:9093

rule_files:
  # - "first_rules.yml"
  # - "second_rules.yml"

scrape_configs:
  - job_name: "prometheus"
    static_configs:
      - targets: ["localhost:9090"]
具体的配置介绍如下:
- global.scrape_interval 是全局配置默认采集时间间隔(周期性采集监控目标)
- global.evaluation_interval是全局配置告警规则任务的计算
- alerting.alertmanagers是配置alertmanagers的地址的,alertmanagers是用来处理prometheus根据告警规则任务计算出来的告警消息的
- rule_files是配置告警规则文件的路径,可以使用通配符
- scrape_configs是配置采集任务的,支持多种类型的采集,比如从k8s、consul、也可以配置静态采集任务。上面的配置是采集prometheus自身的监控指标。可以访问prometheus自身的监控指标的暴露端点:http://localhost:9090/metrics,可以得到prometheus的监控指标,内容如下:
# HELP go_gc_duration_seconds A summary of the pause duration of garbage collection cycles.
# TYPE go_gc_duration_seconds summary
go_gc_duration_seconds{quantile="0"} 4.5782e-05
go_gc_duration_seconds{quantile="0.25"} 7.745e-05
go_gc_duration_seconds{quantile="0.5"} 0.000123743
go_gc_duration_seconds{quantile="0.75"} 0.000251038
go_gc_duration_seconds{quantile="1"} 0.002707693
go_gc_duration_seconds_sum 0.009608685
go_gc_duration_seconds_count 35
# HELP go_goroutines Number of goroutines that currently exist.
# TYPE go_goroutines gauge
go_goroutines 32
# HELP go_info Information about the Go environment.
# TYPE go_info gauge
go_info{version="go1.21.1"} 1
# HELP go_memstats_alloc_bytes Number of bytes allocated and still in use.
# TYPE go_memstats_alloc_bytes gauge
go_memstats_alloc_bytes 2.1363728e+07
# HELP go_memstats_alloc_bytes_total Total number of bytes allocated, even if freed.
# TYPE go_memstats_alloc_bytes_total counter
go_memstats_alloc_bytes_total 3.82033736e+08
# HELP go_memstats_buck_hash_sys_bytes Number of bytes used by the profiling bucket hash table.
# TYPE go_memstats_buck_hash_sys_bytes gauge
go_memstats_buck_hash_sys_bytes 1.489234e+06
...
采集Node Exporter的指标
Node Exporter是Prometheus生态的一员,它为主机暴露了硬件和内核相关的指标,比如主机的cpu、内存、磁盘、io读写等。目前支持linux系统、windows系统和mac系统,下载地址为:
https://github.com/prometheus/node_exporter/releases
下载完成后,启动node_exporter,node_exporter的端口为9100,访问http://localhost:9100/metrics,就可以查看node_exporter暴露的端口指标。
在prometheus的配置文prometheus.yml中,增加采集Node Exporter的任务,配置信息如下:
scrape_configs:
  - job_name: "prometheus"
    static_configs:
      - targets: ["localhost:9090"]
  - job_name: "node_exporter"
    static_configs:
      - targets: ["localhost:9100"]
重新启动prometheus的程序,prometheus 就可以采集Node_Exporter的指标了。
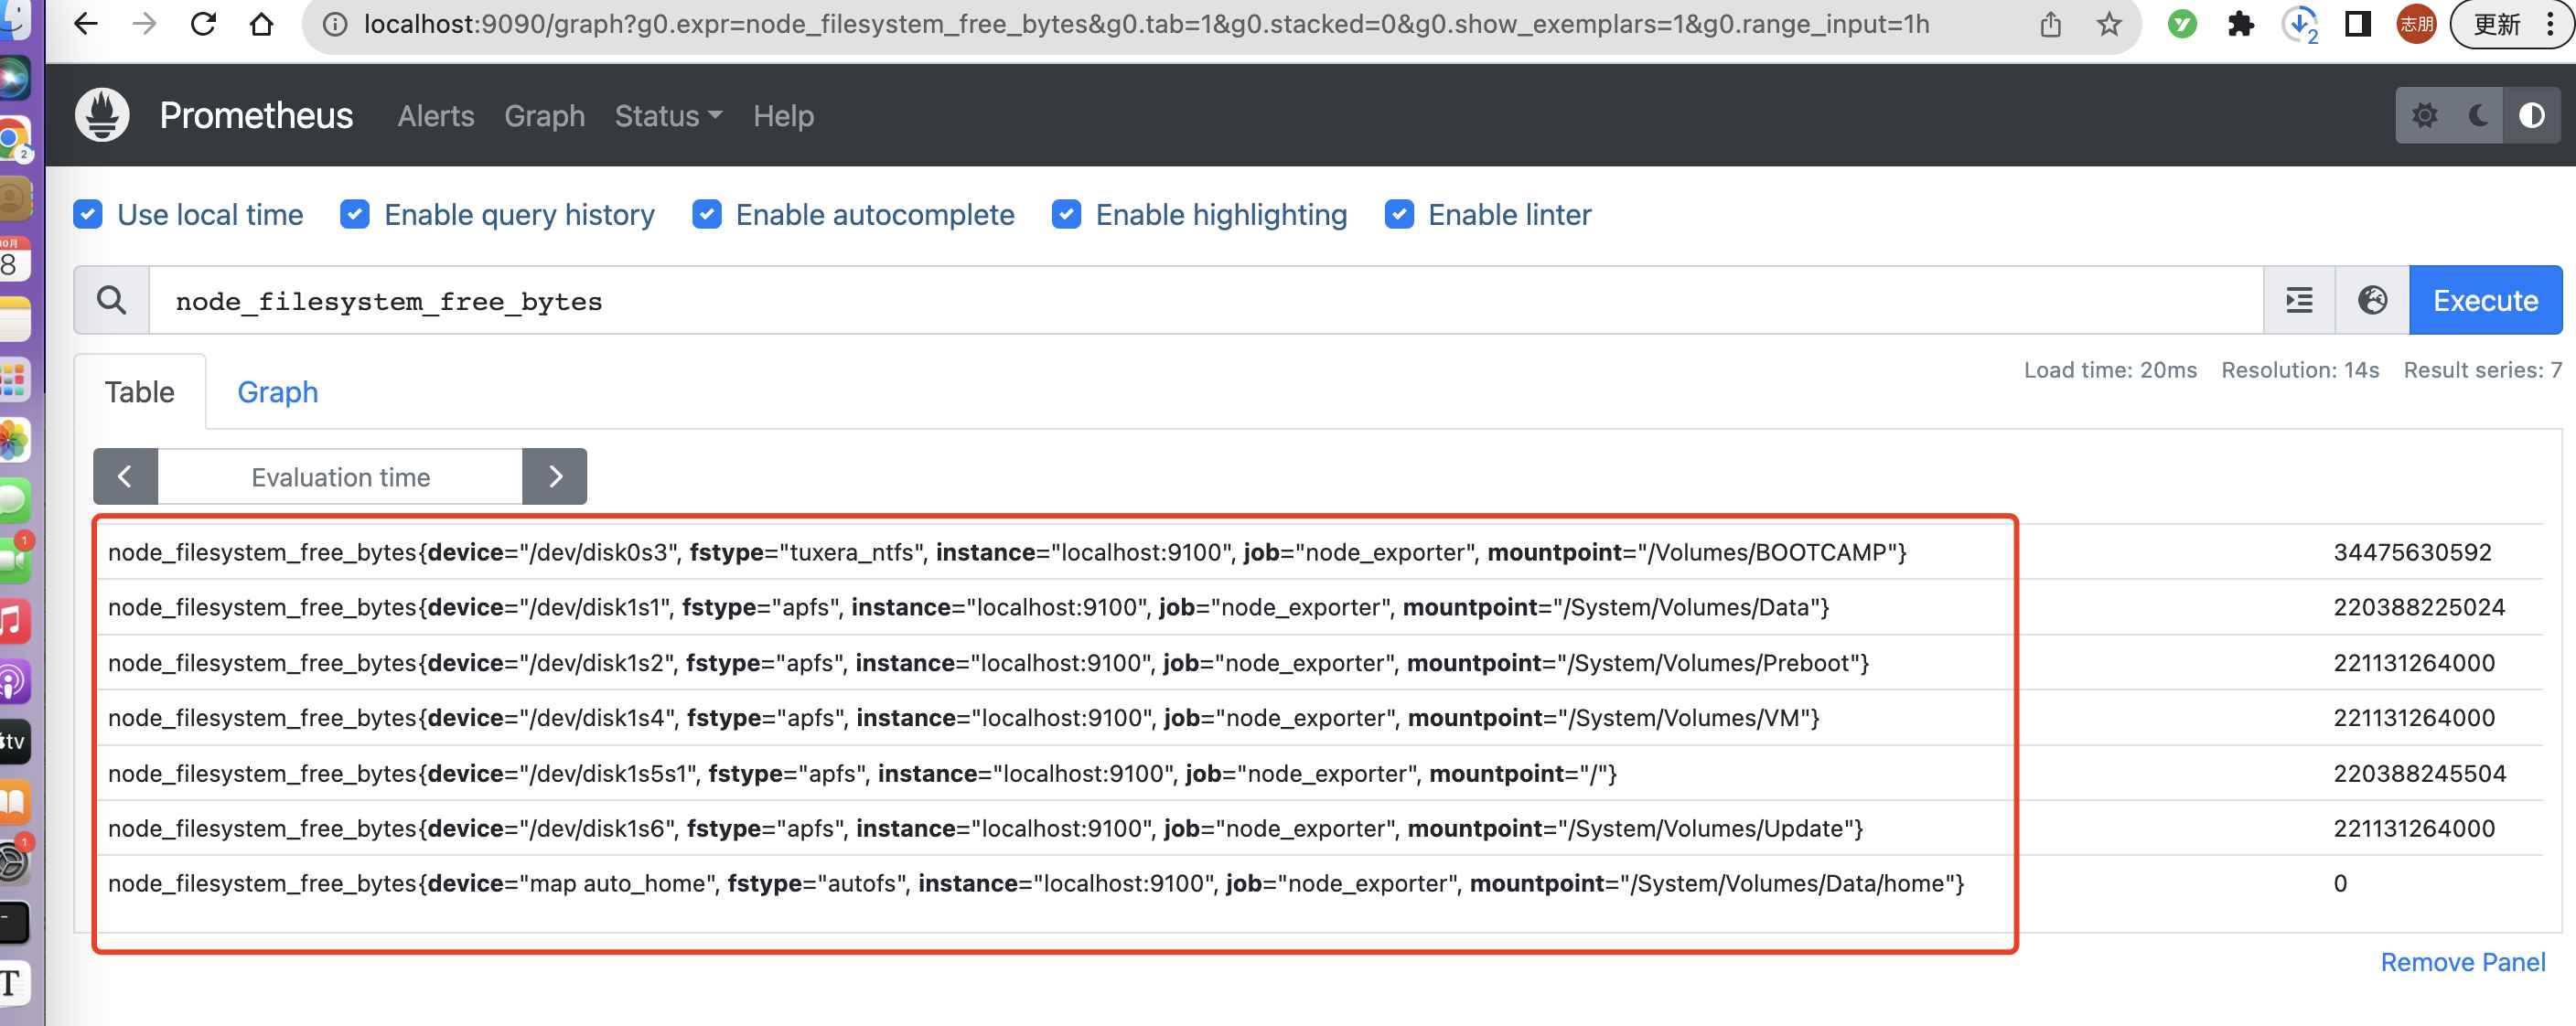
访问prometheus的网页,http://localhost:9090/graph,在查询框里输入node_filesystem_free_bytes(文件系统里剩余的磁盘字节数),就可以看到各个目录的磁盘剩余字节数了。
prometheus配置文件热更新
在prometheus启动的时候加上启动参数--web.enable-lifecycle,具体命令如下:
prometheus --web.enable-lifecycle
在更改完配置以后,就可以进行配置的热更新,通过拉prometheus的配置热更新接口,接口如戏:
curl -XPOST http://localhost:9090/-/reload
grafana安装
Grafana是一个开源的、流行的、炫酷的展示数据的可视化仪表盘,它支持多种类型的数据库,提供了非常多的面板和插件,可以让开发者轻松的实现监控大盘。
grafana可以完美的和prometheus结合,展示prometheus数据。
进入grafana官网下载安装包,笔者是mac,所以下载的是mac版本的,下载命令如下:
curl -O https://dl.grafana.com/enterprise/release/grafana-enterprise-10.1.4.darwin-amd64.tar.gz
tar -zxvf grafana-enterprise-10.1.4.darwin-amd64.tar.gz
下载并解压成功后,进入到grafana的安装目录,启动grafana,启动命令如下:
./bin/grafana-server
grafana有很多配置项在conf目录下default.ini文件下,此篇文章不讲解这部分内容。
启动成功后,进入grafana的页面,地址为localhost:3030 ,grafana的默认登陆用户名admin、密码为admin
登陆成功后,需要为grafana配置prometheus的数据源,配置界面的路径和配置如下:
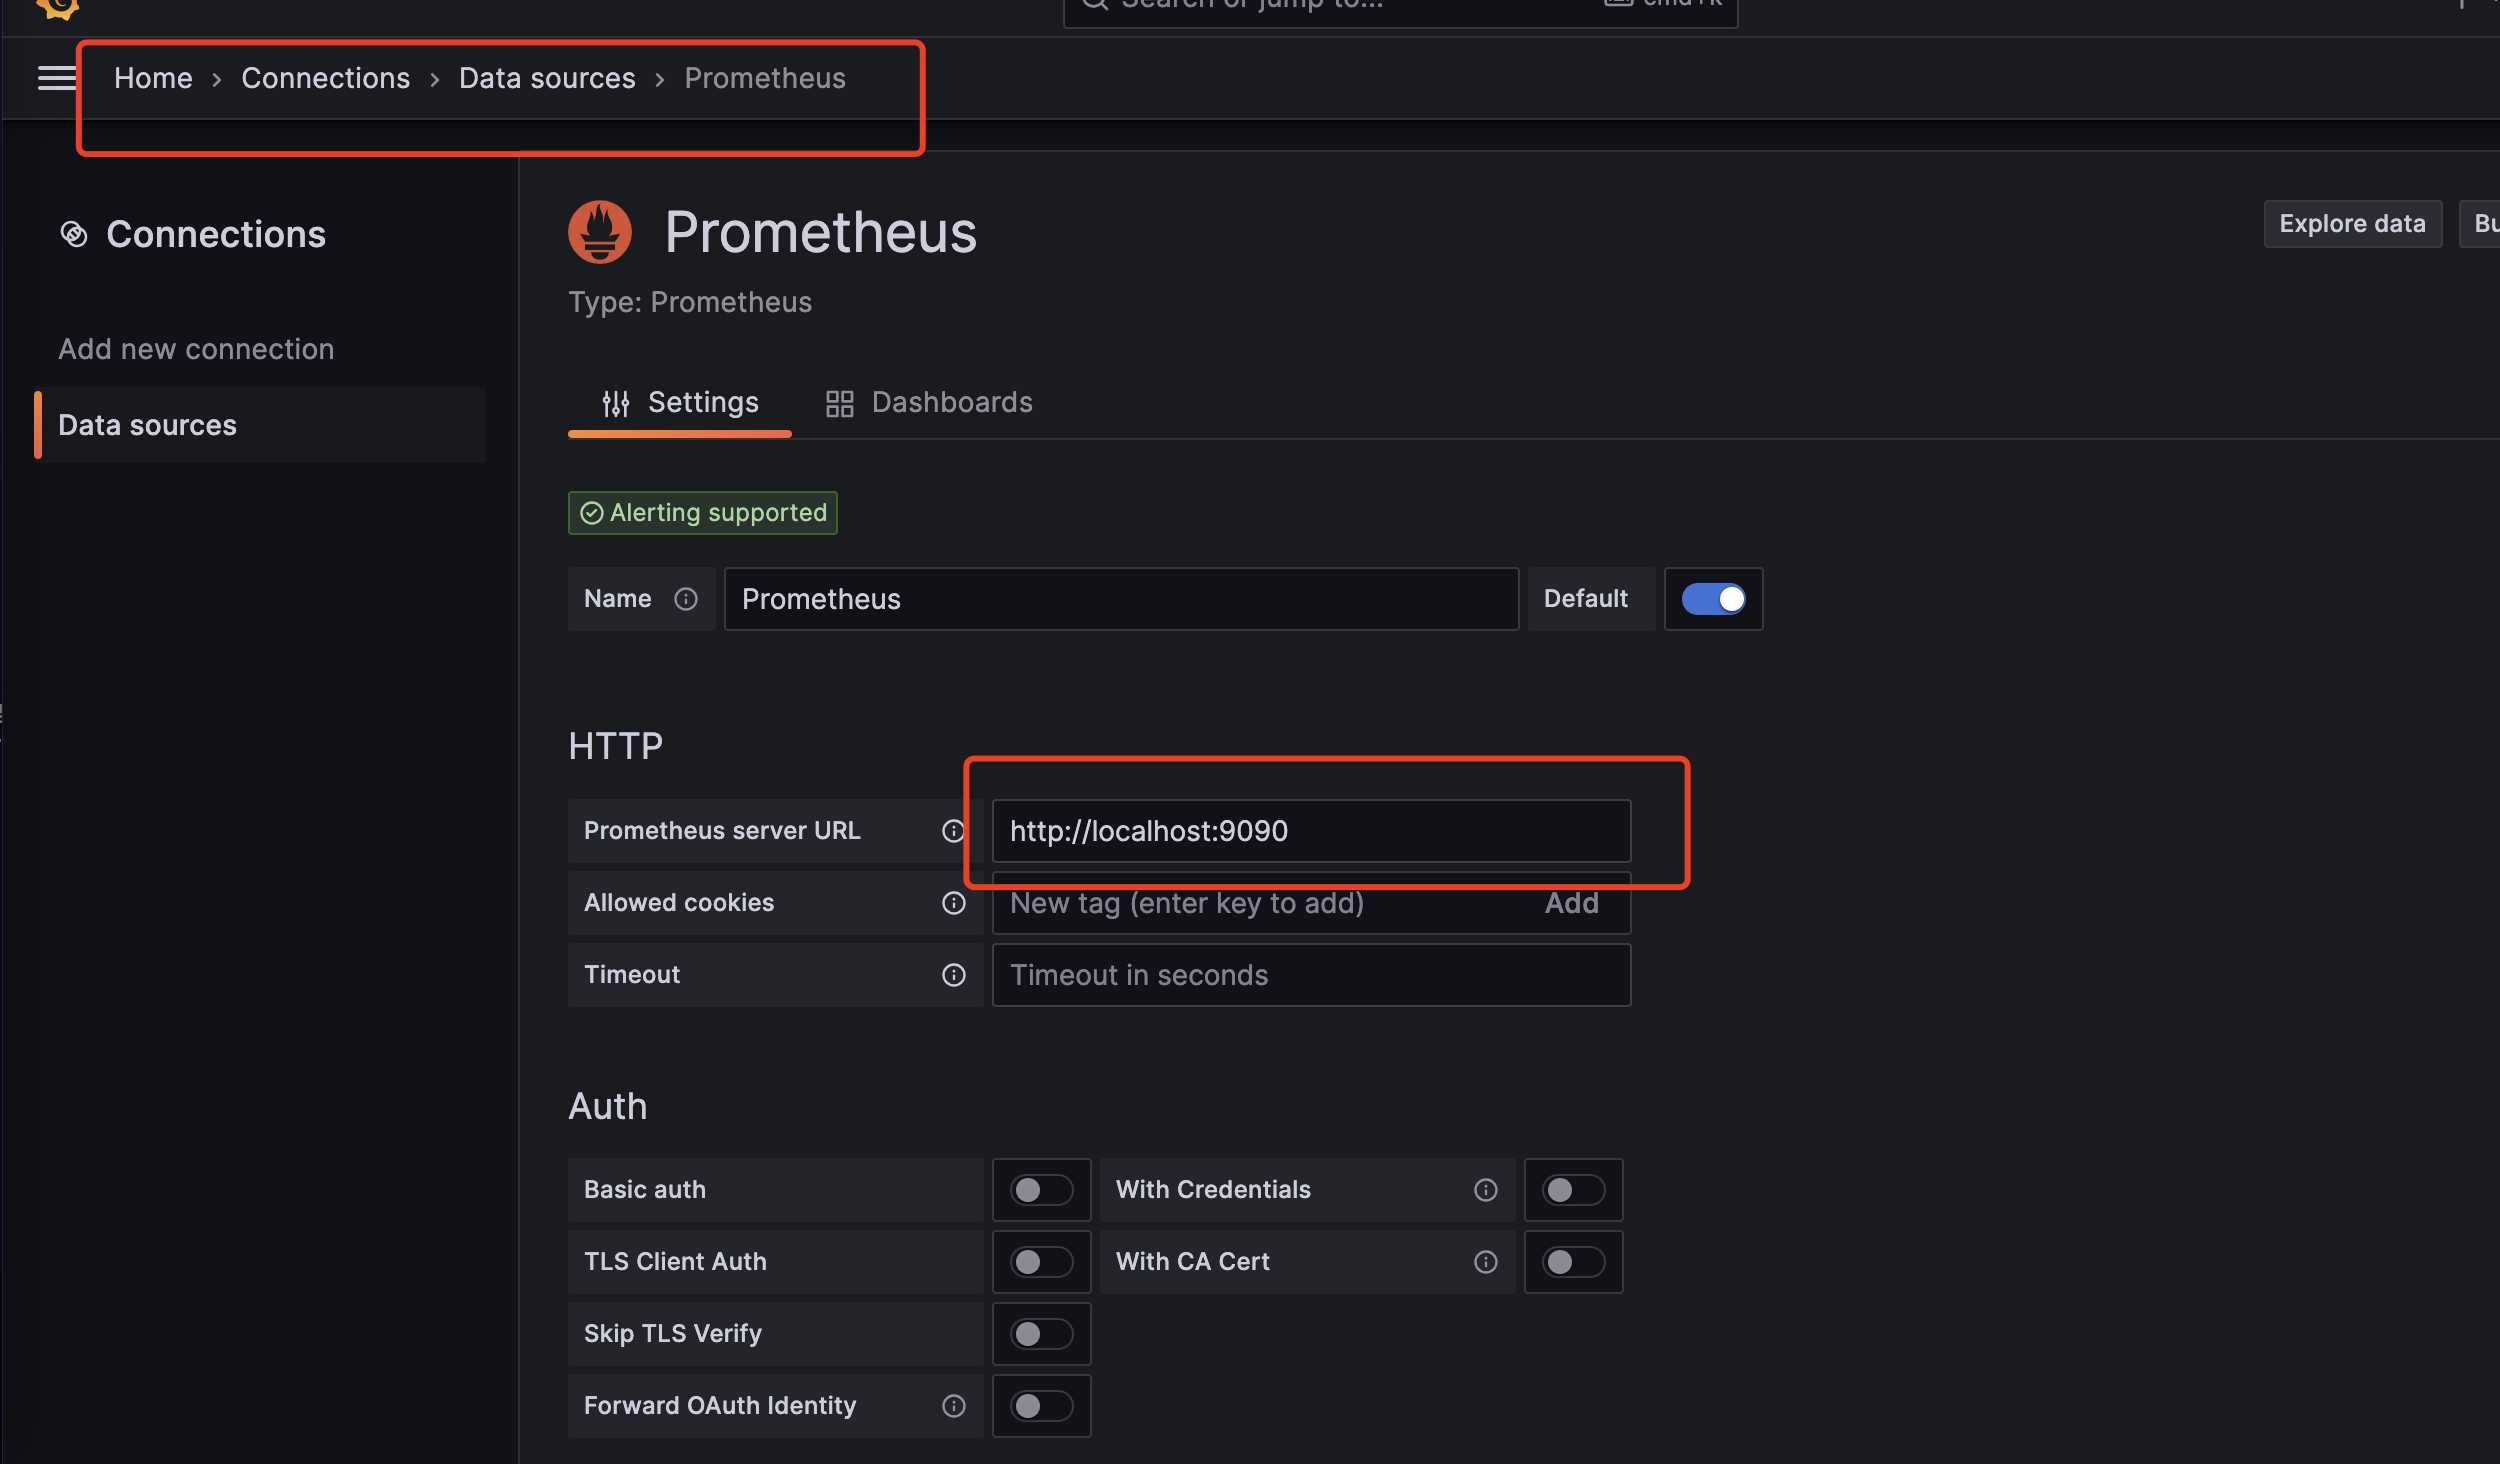 配置完成后保存。
然后去grafana官方网站的dashboard社区找一个node exporter的面板,搜索地址:https://grafana.com/grafana/dashboards/?pg=community&plcmt=topnav&search=node+exporter+mac
搜索成功后,在本地部署的grafana页面导入node exporter的dashboard,页面的导入路径如下:
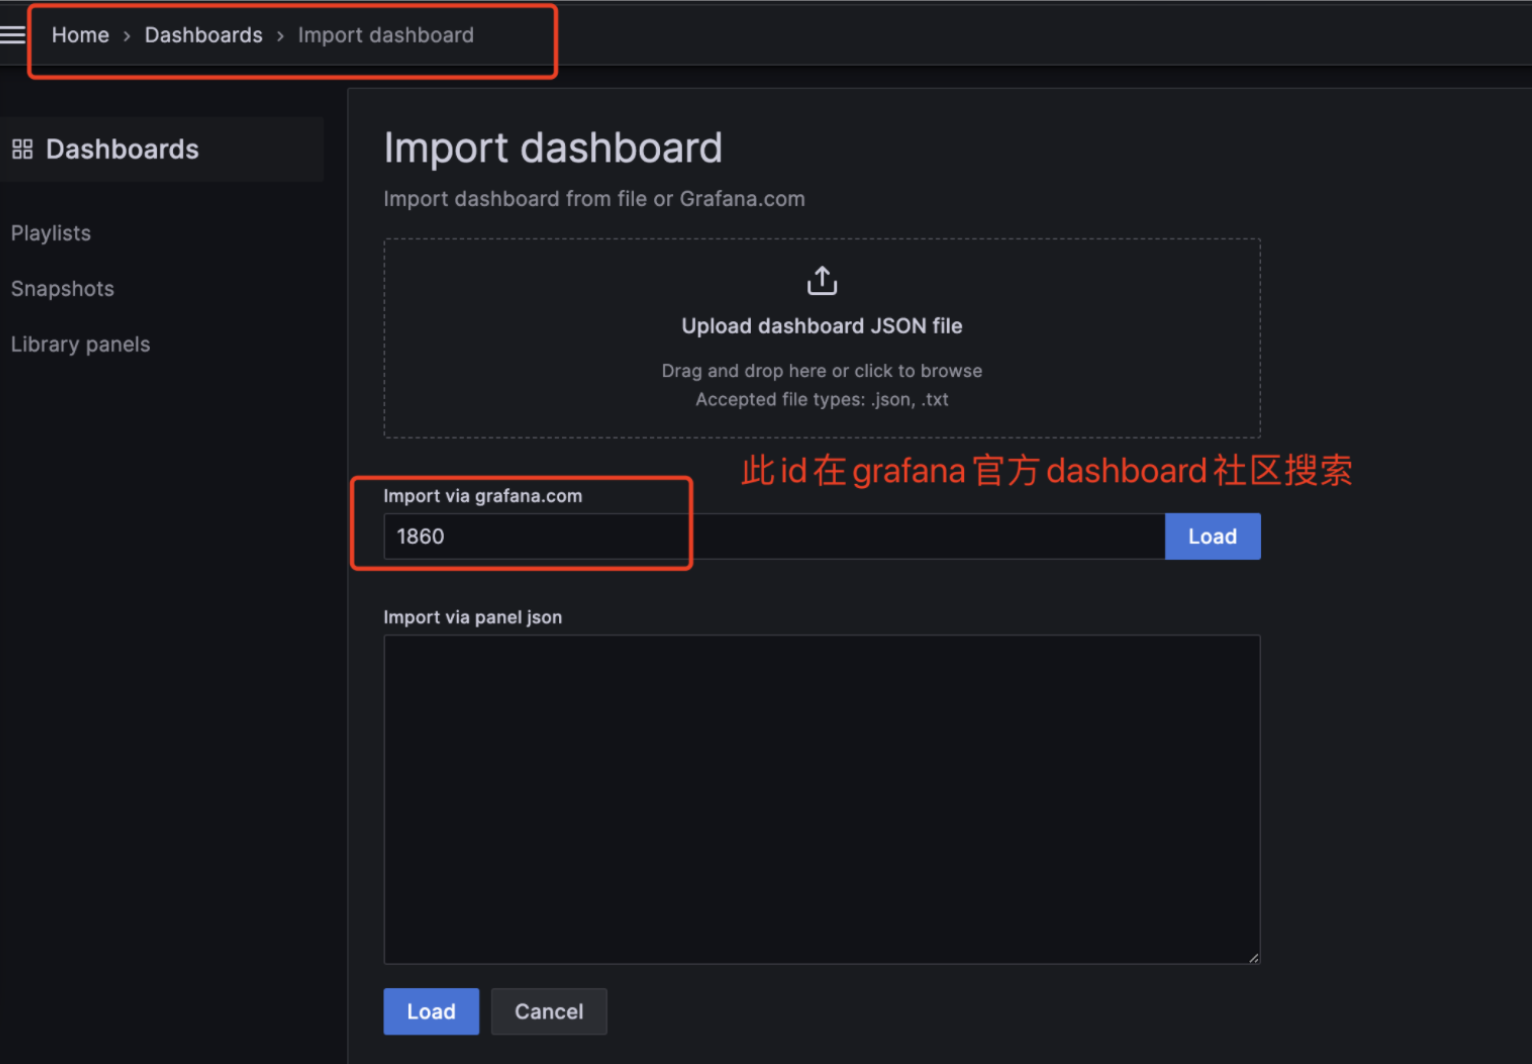
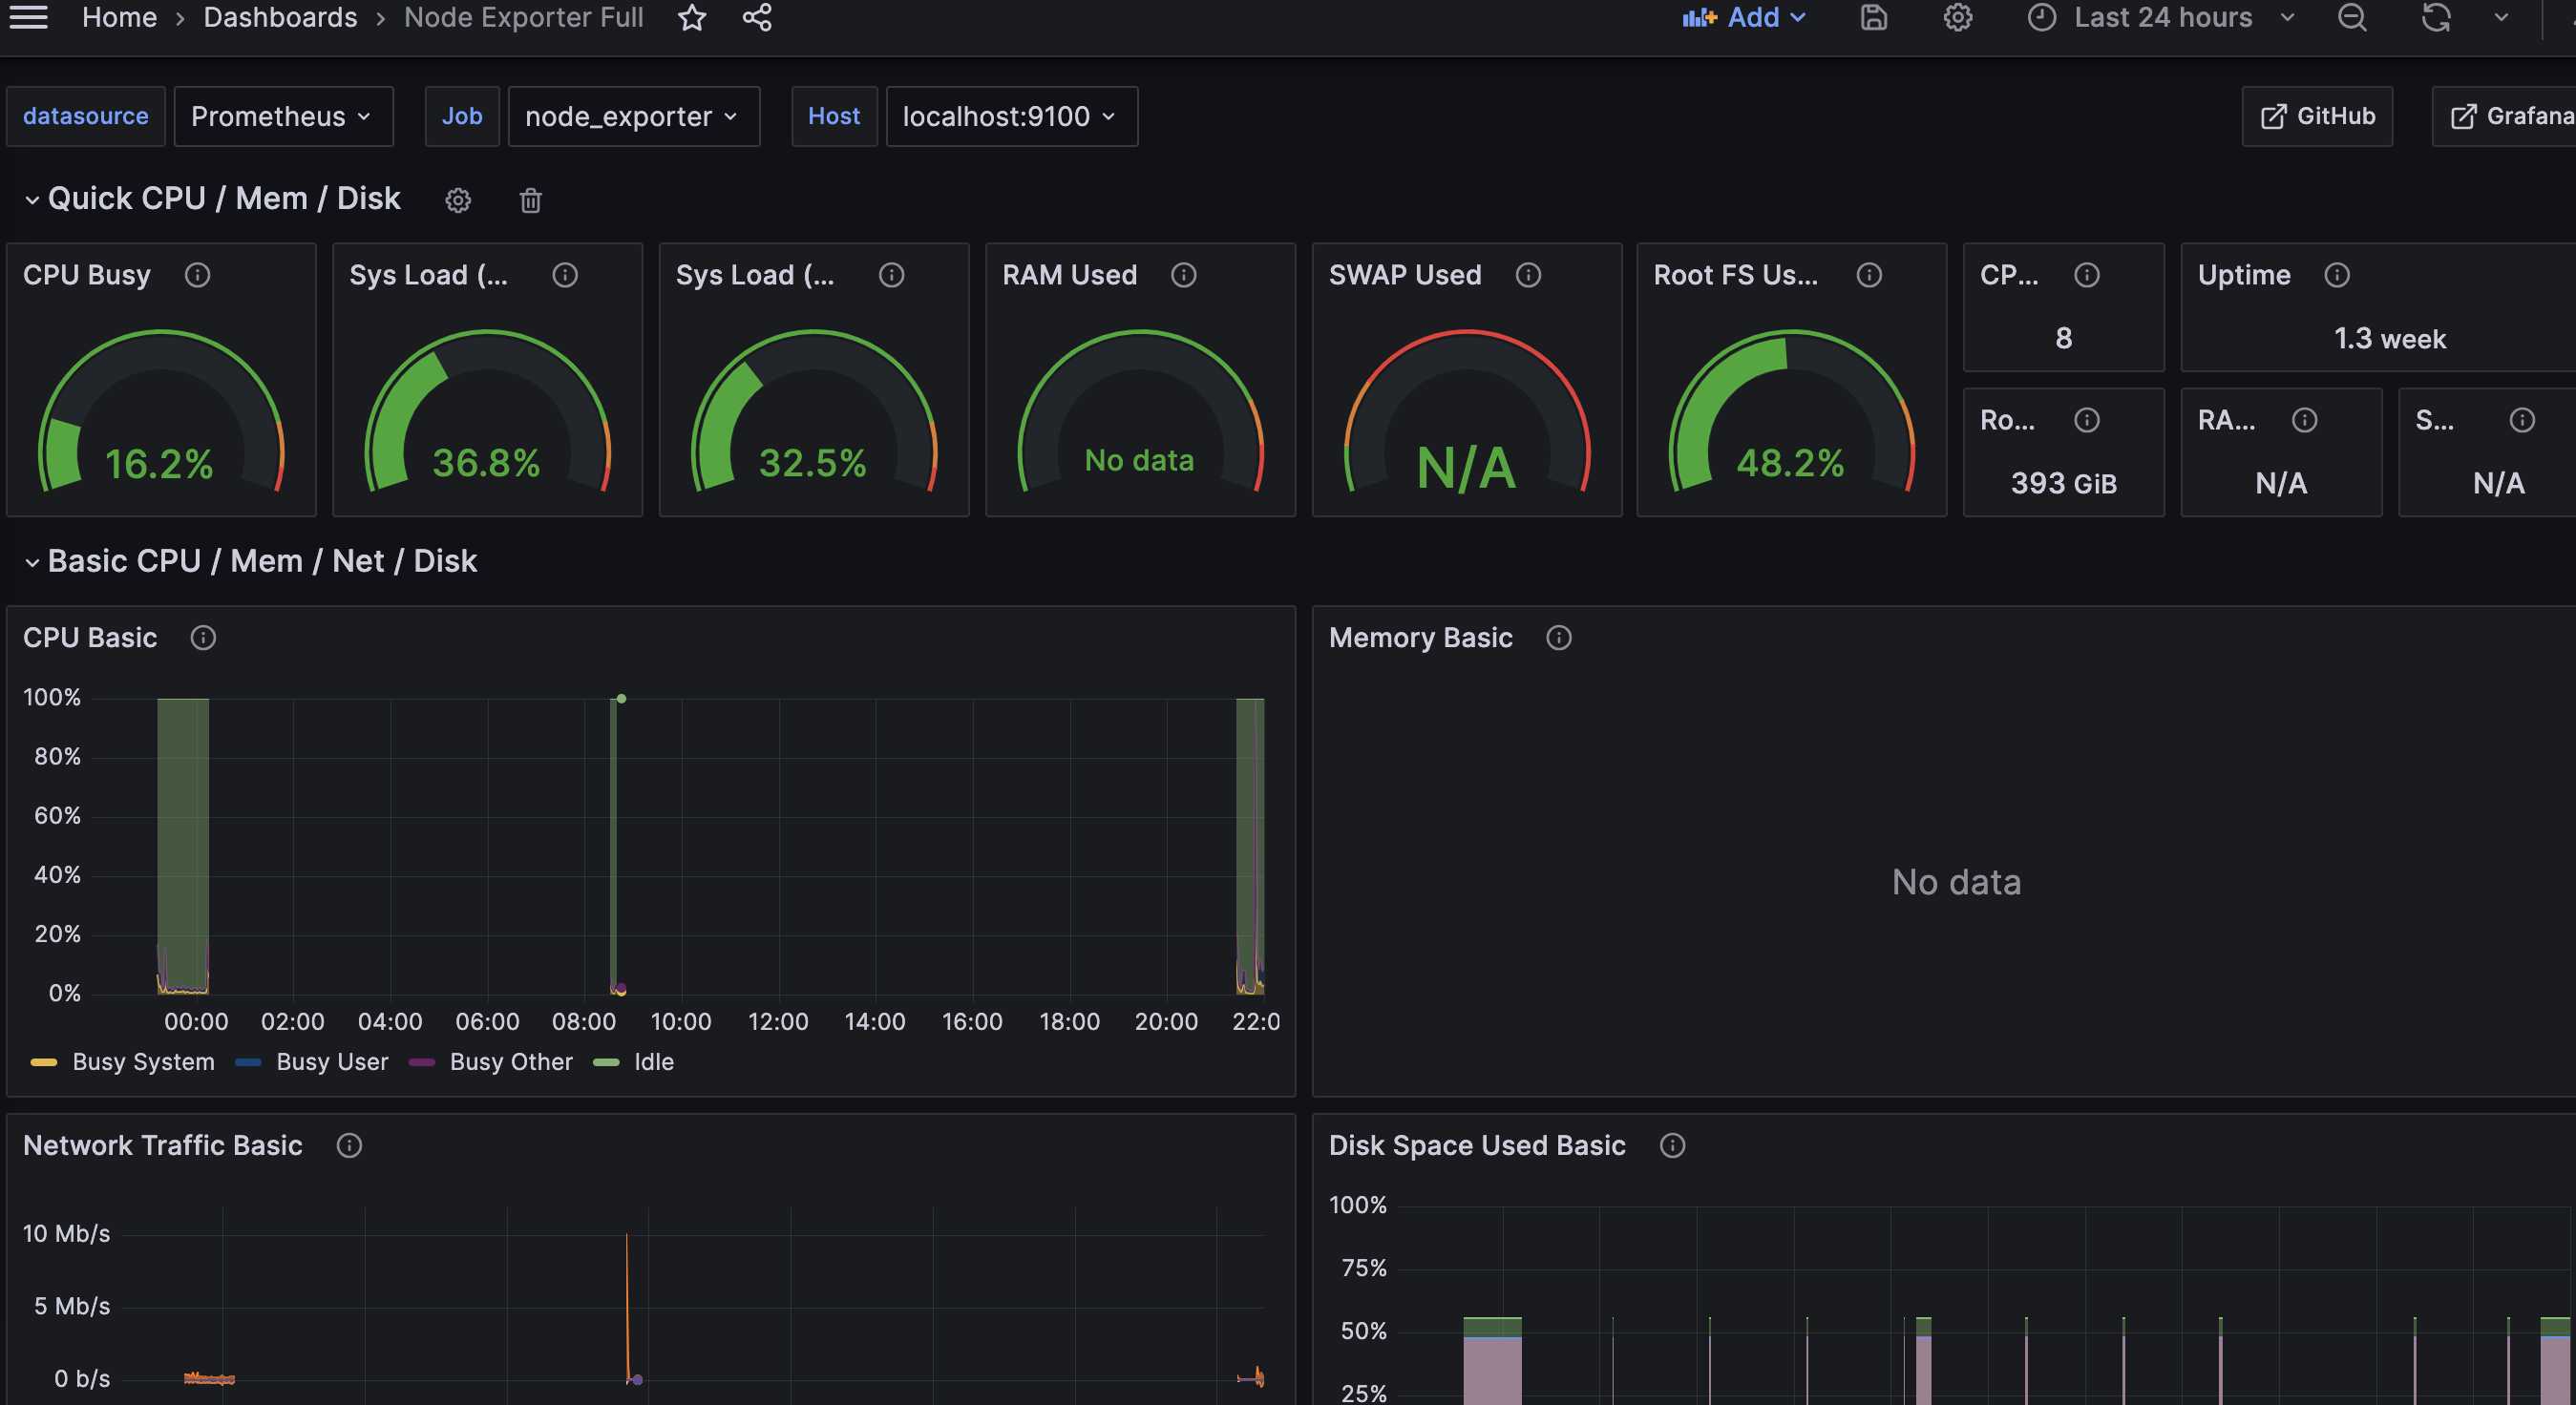
导入成功后,就可以看到本机的资源dashboard(由node exporter采集的指标生产)
总结
- prometheus作为一个采集组件,采集了node-exporter的指标
- 同时prometheus作为一个时序数据库,存储了node-expoter的指标时序
- grafana作为数据展示前端,读取prometheus的指标时序,并展示在监控大盘上。
