Promql快速入门
prometheus的时间序列是通过指标名和一组标签来唯一定义。指标的名称是监控样本的标识,而标签组是监控样本的多个维度特征的反应,所以可以通过标签进行对指标的筛选、过滤、聚合、转换等计算,计算的结果会产生一条新的时间序列。
promql是Prometheus提供的数据查询语言,可以对时间序列提供丰富的查询。promql被广泛应用于指标视图的配置、告警语句的配置,它是一个基础能力,类似于mysql的sql查询语句。
瞬时向量查询(Instant vector selectors)
我们可以直接输入指标名查询所有的这个指标名的时间序列,比如:
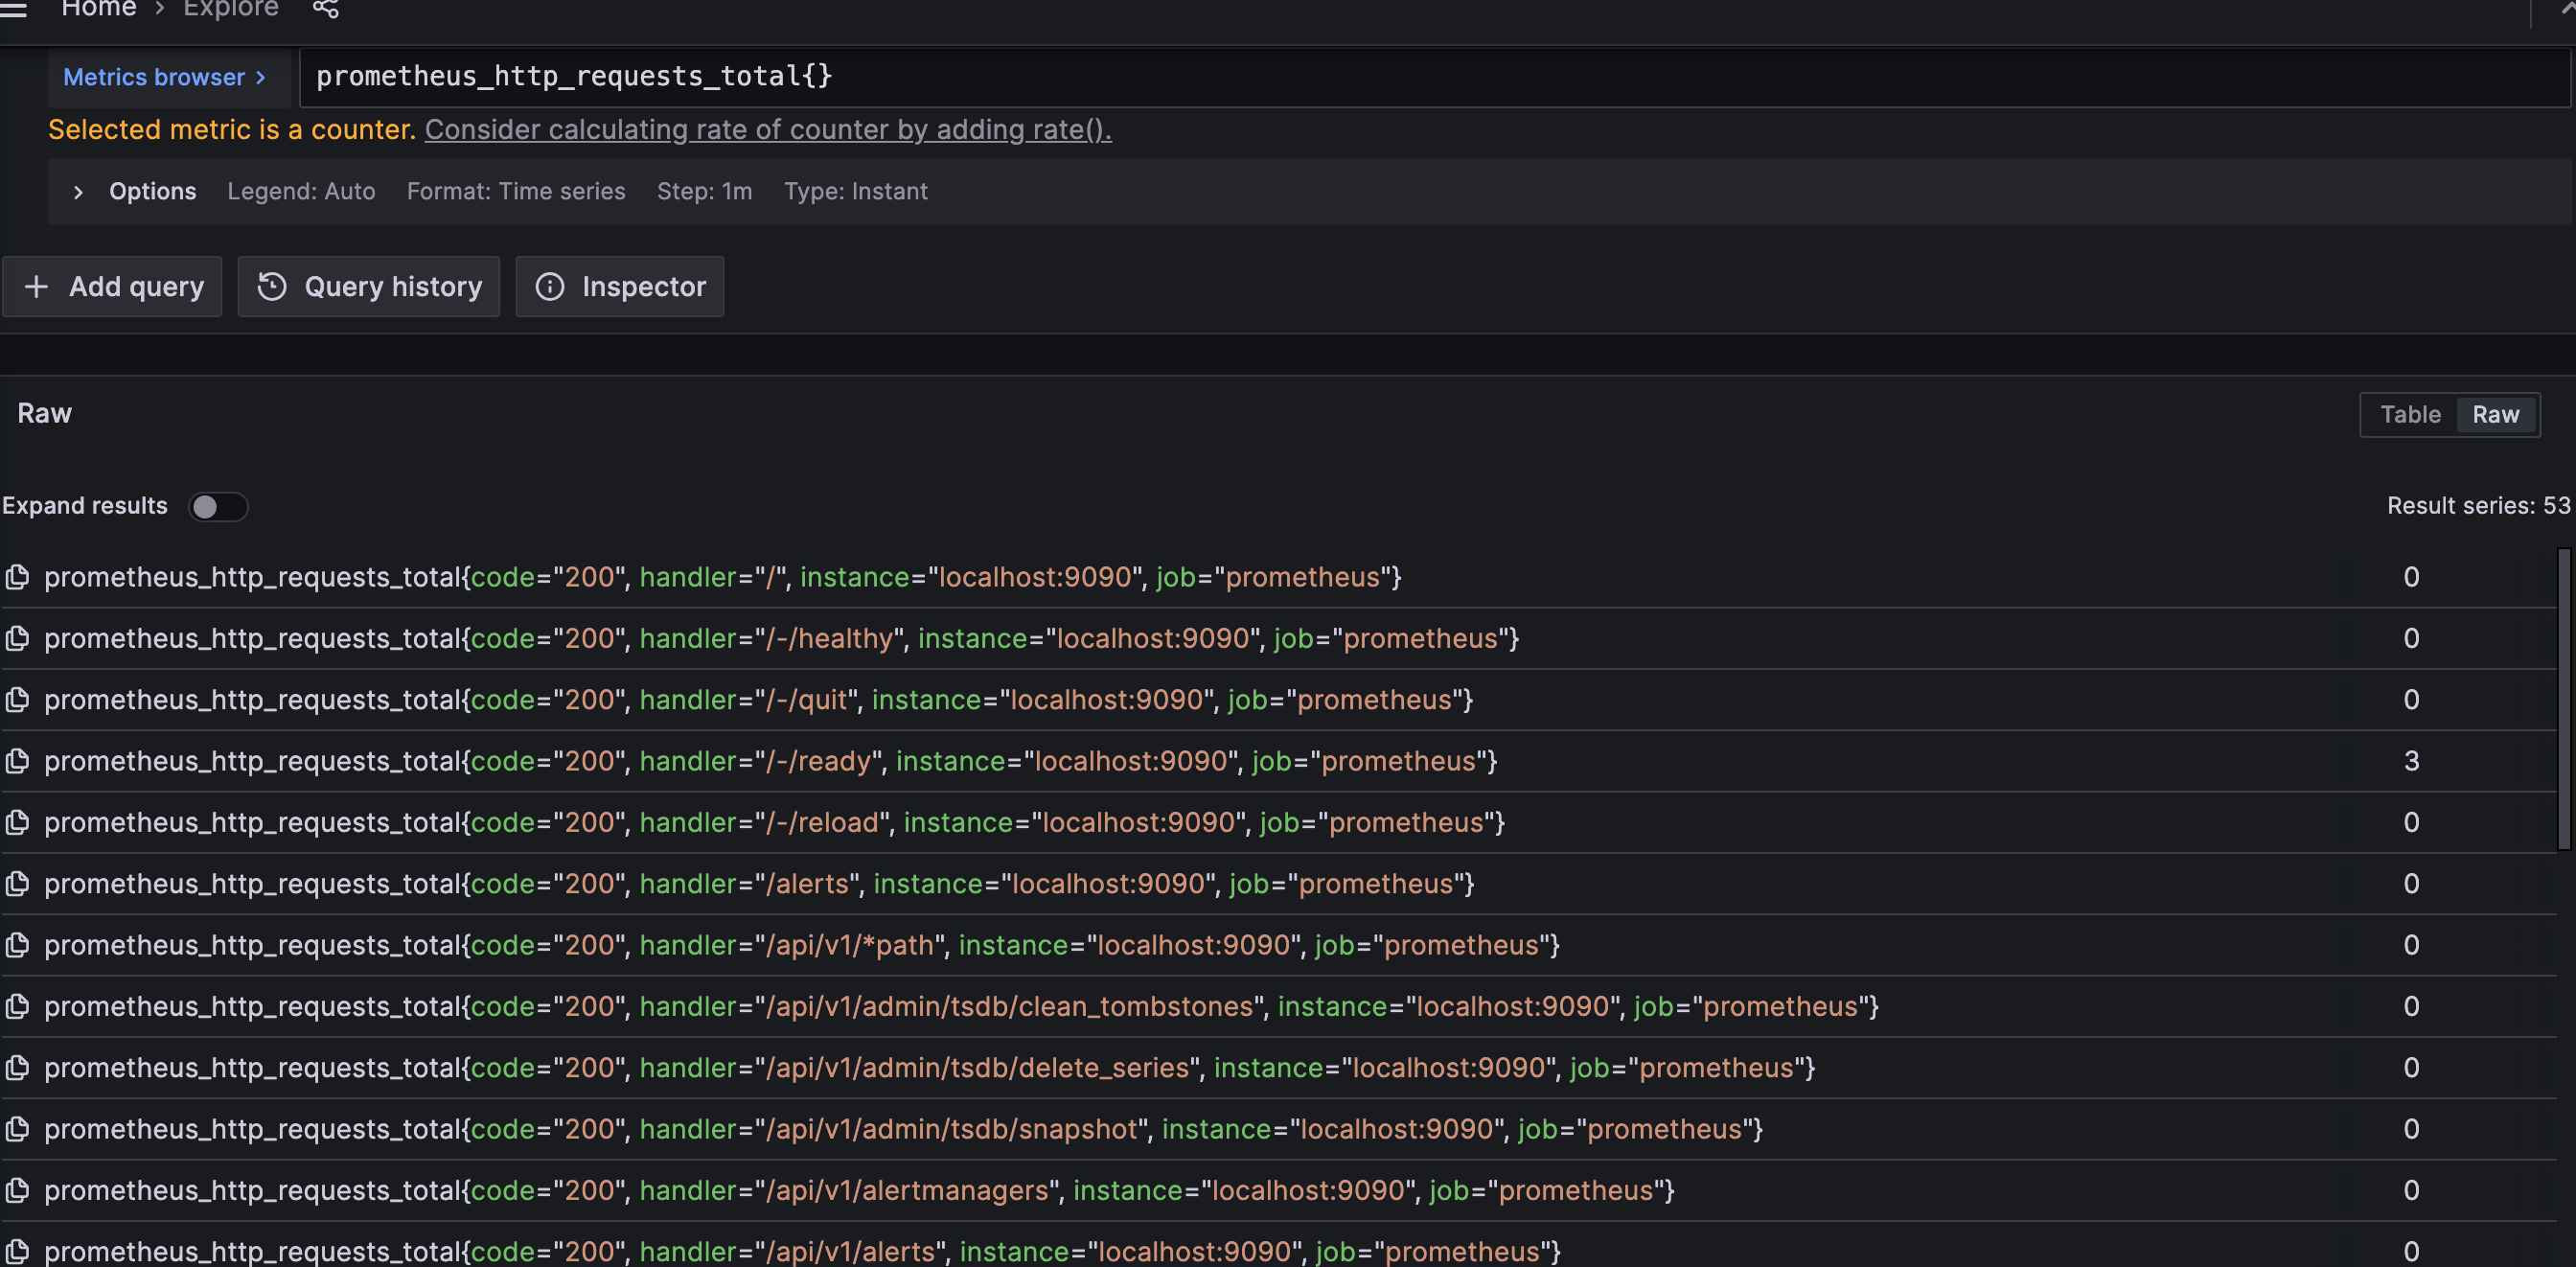
prometheus_http_requests_total
上面的语句等同于:
prometheus_http_requests_total
可以在grafana上查询,获取了prometheus_http_requests_total指标的不同标签维度的所有指标,一共有53个。
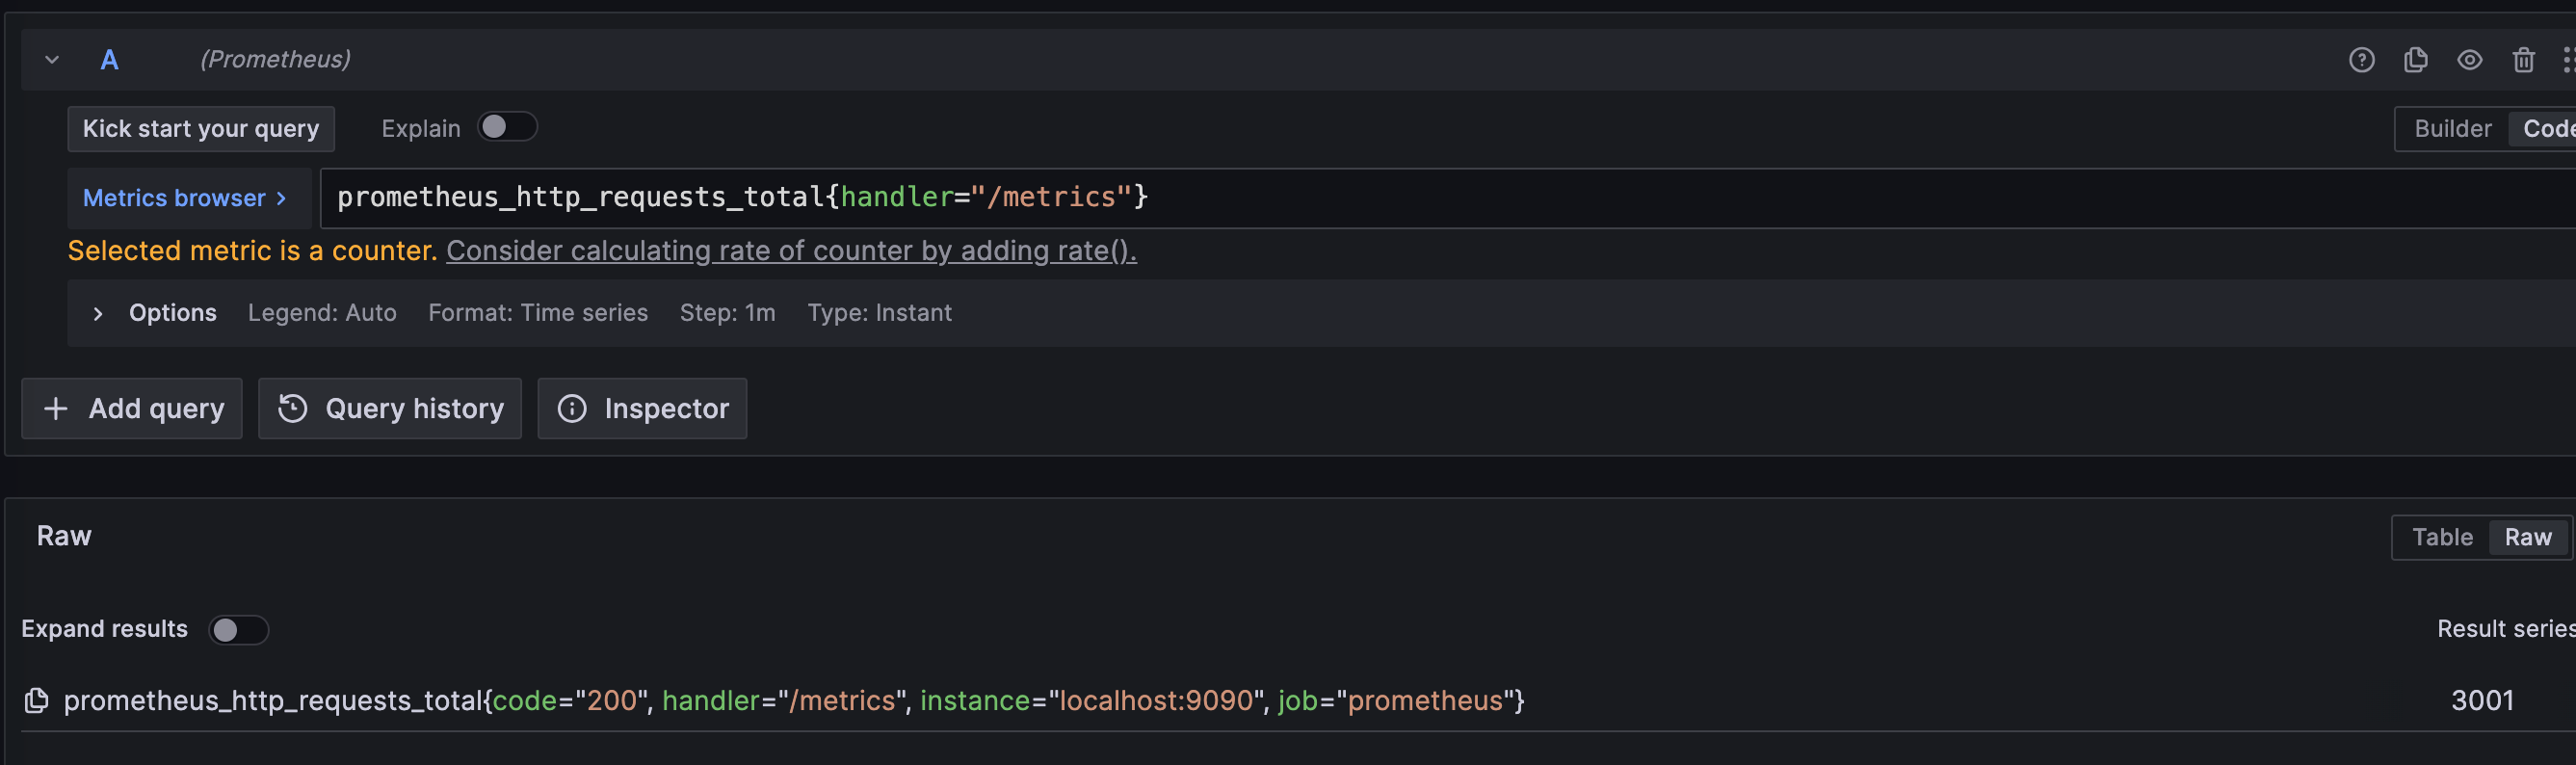
可以筛选出handler=“/metrics"接口的数据,在grafana执行:
prometheus_http_requests_total{handler="/metrics"}
另外也可以筛选出handler!=“/metrics"的所有的数据,查询语句为:
prometheus_http_requests_total{handler!="/metrics"}
也可以使用多个标签值进行进行查询,比如查询handler为"/metrics“和handler为"/api/v1/labels"的指标情况:
prometheus_http_requests_total{handler=~"/metrics|/api/v1/labels"}
同理,也查询handler不为"/metrics“和handler不为"/api/v1/labels"的指标情况:
prometheus_http_requests_total{handler!~"/metrics|/api/v1/labels"}
也可以使用.*通配符进行模糊匹配查询:
prometheus_http_requests_total{handler=~"/metric.*"}
小结:
使用标签筛选数据的使用,可以使用完全匹配:
- label = value
- lable =~ value | value2
也可以进行模糊匹配:
- label =~ value.*
取反操作
- label != value
- Label !~ value1 |value2
- Label !~ value.*
范围向量查询(Range Vector Selectors)
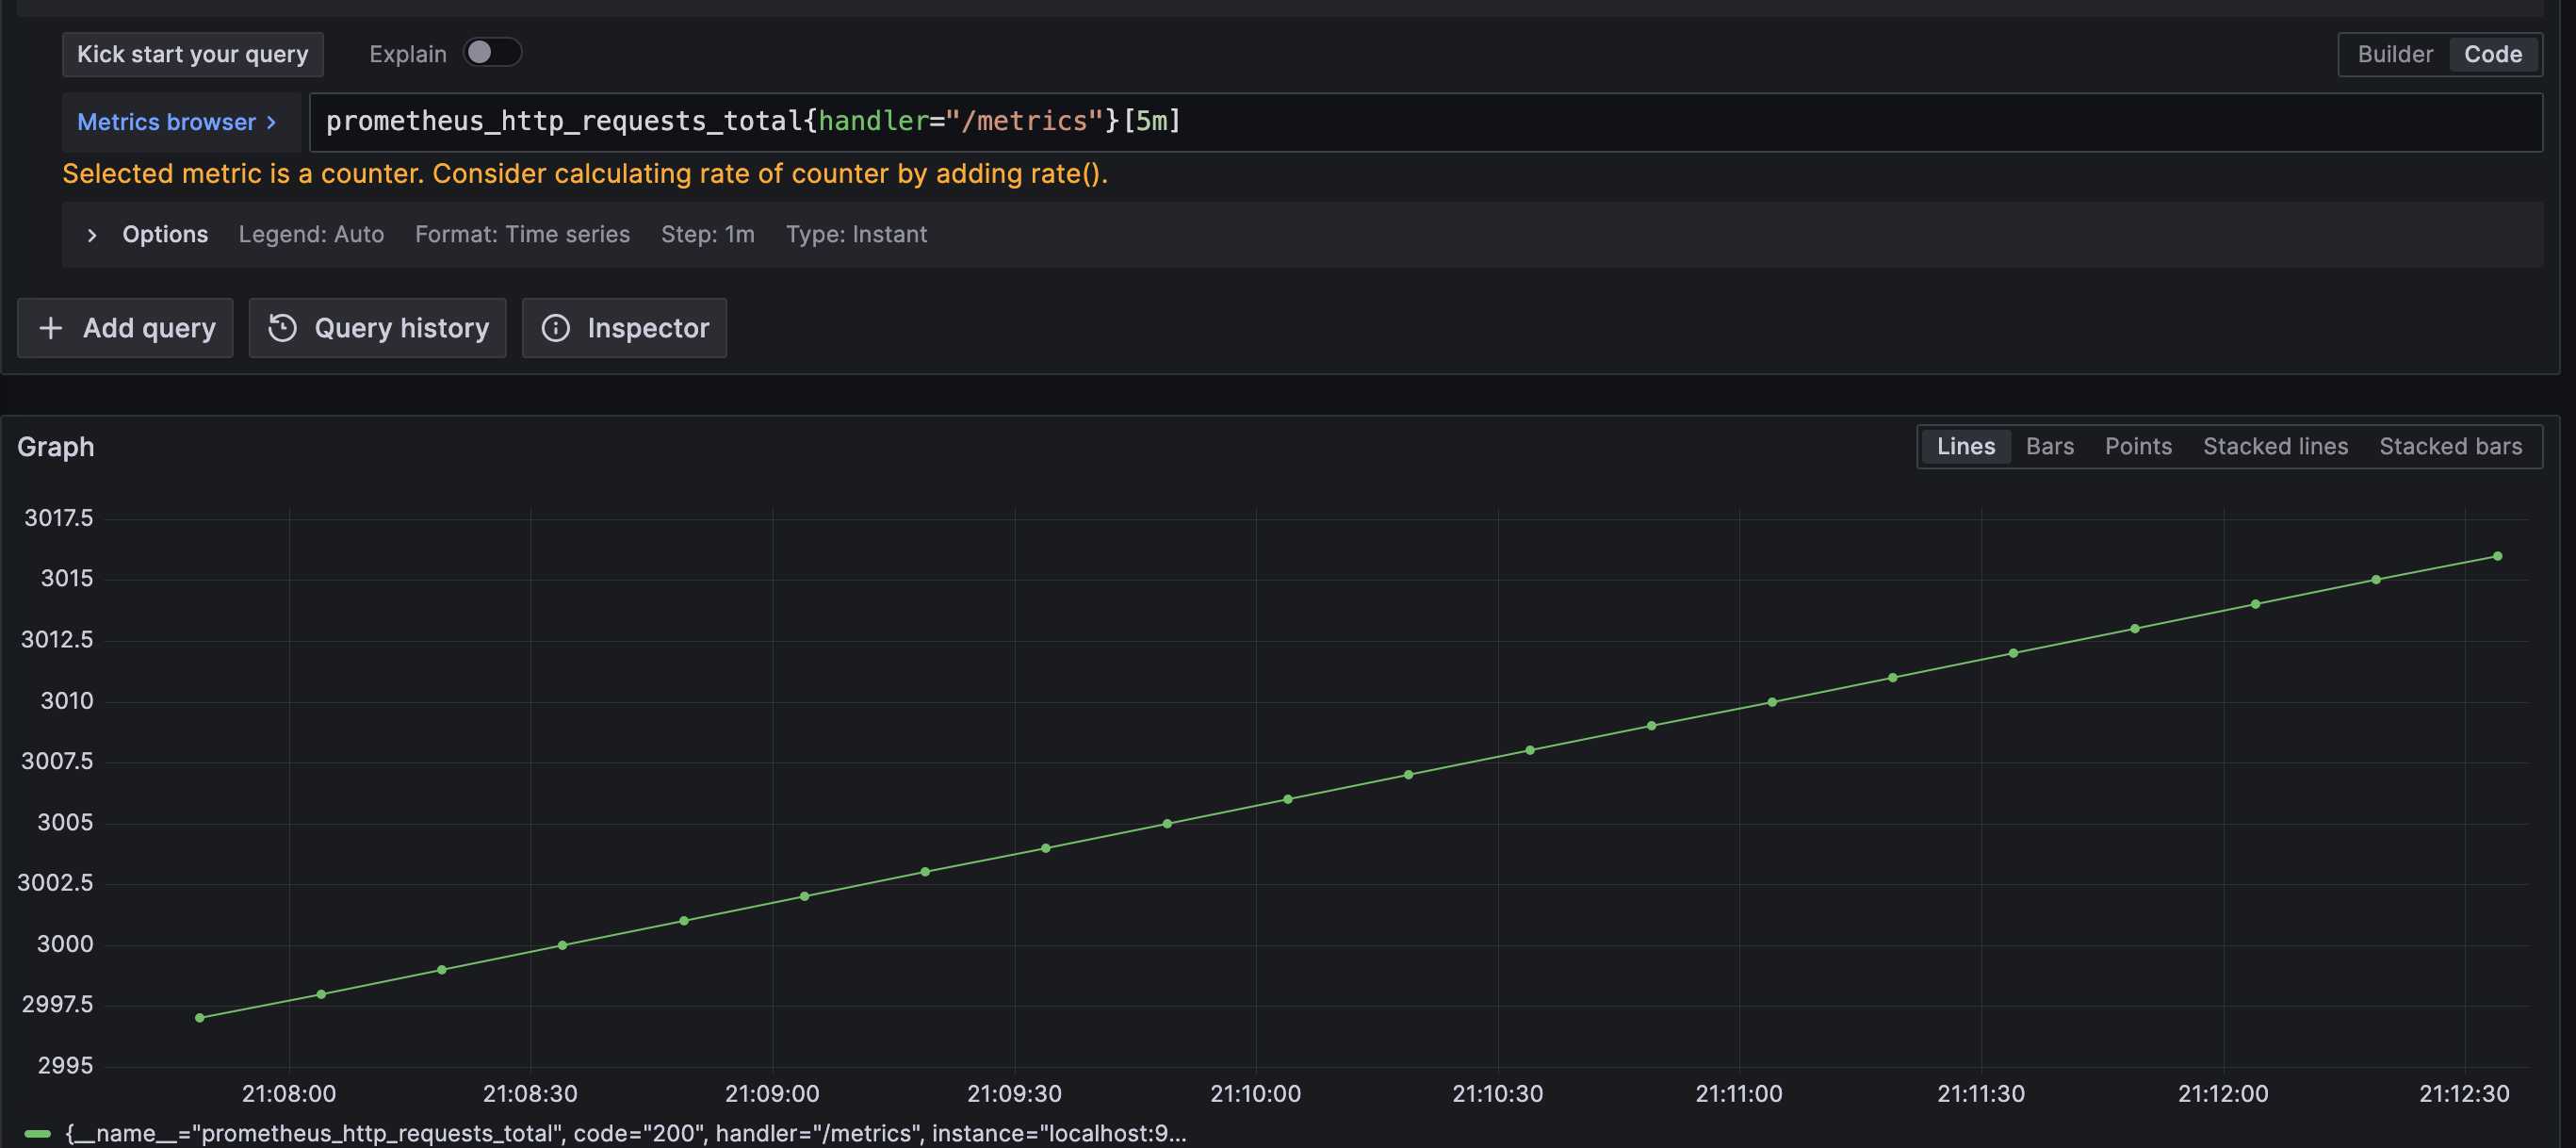
通过Instant vector selectors查询,返回值只会包含该时间序列的最新值的一个样本,它是一个瞬时向量结果。如果我们想查询一个时间区间的样本,可以使用范围矢量查询。范围向量表达式和瞬时向量表达式之间的差异在于在区间向量表达式中我们需要定义时间选择的范围,时间范围通过时间范围选择器[]进行定义。例如,通过以下表达式可以选择最近5分钟内的所有样本数据:
prometheus_http_requests_total{handler="/metrics"}[5m]
时间范围除了支持分钟(m)外,还还支持
- 秒(s)
- 分钟(m)
- 小时(h)
- 天(d)
- 周(w)
- 年(y)
offset 时间位移操作
瞬时向量查询和范围向量查询的表达式中,都是以当前时间为基准的,比如:
- prometheus_http_requests_total{},查询当前时间的最新值
- prometheus_http_requests_total{}[5m],查询的是当前时间的过去五分钟的数据。
如果想查询五分钟前的数据,获取昨天的当前时间同一时刻的五分钟的数据,怎么查询呢,我们可以使用offset关键字:
- prometheus_http_requests_total{} offset 5m,查询五分钟前的最新值
- prometheus_http_requests_total{}[5m] offset 1d,查询的是昨天的当前时间同一时刻的五分钟的数据
操作符
数学操作符
Promql支持常见的逻辑和数学操作符,这些操作符使用于瞬时向量的查询,常见的逻辑运算符如下
+(addition) 加-(subtraction) 减*(multiplication) 乘/(division) 除%(modulo) 取模^(power/exponentiation) 幂运算
在作用于两个瞬时向量之间,左侧的标签条目和右侧的标签条目必须要相同,否则将匹配不到,不会输出结果。如果匹配到了,会将计算结果输出到新的向量上,向量里面的标签是左侧和右侧共同匹配的标签,指标名将会被删除。
例如下面的查询语句不会输出任何结果,因为两个handler标签值不一样。
prometheus_http_requests_total{handler="/metrics"}+prometheus_http_requests_total{handler="/api/v1/labels"}
再比如下面的查询语句的可以输出结果,因为左侧的表达式有一个handler="/metrics",右侧的表达式也有一个handler="/metrics"标签,完全匹配,所以能够输出:
sum(prometheus_http_requests_total{handler="/metrics"})by(handler)+sum(prometheus_http_request_duration_seconds_count{handler="/metrics"})by(handler)
比较操作符
promql还支持常见的比较运算符,比如:
==(equal)!=(not-equal)>(greater-than)<(less-than)>=(greater-or-equal)<=(less-or-equal)
当比较运算符左右与两个瞬时向量之间,同操作运算符一样,左侧的标签条目和右侧的标签条目必须要相同,否则将匹配不到,不会输出结果。
逻辑运算符
逻辑运算符作用于两个瞬时向量之间,支持的逻辑运算符如下:
and(intersection) 求交集or(union) 求并集unless(complement)
当比较运算符左右与两个瞬时向量之间,同操作运算符一样,左侧的标签条目和右侧的标签条目必须要相同,否则将匹配不到,不会输出结果。
向量匹配符号 Vector matching
在上面讲解的操作符,比如左侧和右侧的向量标签组条目必须完全匹配才能进行计算。在promql中也可以使用向量匹配符去计算含有不同标签条组的向量之间的计算,promql提供了两个向量匹配符号
- on (匹配)
- Ignoring (忽略)
使用上面的Vector matching,可以应用于One-to-one vector matches(一对一)和Many-to-one and one-to-many vector matches(一对多或者多对一)
分组修改器 Group modifiers
分组修改器可以实现many-to-one/one-to-many的向量匹配,通常使用以下的关键字:
group_leftgroup_right
分组修改器可以一边的标签组赋值给另一边的查询结构。
举例子讲解
比如有以下的时间序列的样本:
method_code:http_errors:rate5m{method="get", code="500"}  24
method_code:http_errors:rate5m{method="get", code="404"}  30
method_code:http_errors:rate5m{method="put", code="501"}  3
method_code:http_errors:rate5m{method="post", code="500"} 6
method_code:http_errors:rate5m{method="post", code="404"} 21

method:http_requests:rate5m{method="get"}  600
method:http_requests:rate5m{method="del"}  34
method:http_requests:rate5m{method="post"} 120
使用以下的查询:
method_code:http_errors:rate5m{code="500"} / ignoring(code) method:http_requests:rate5m
得到的结果是:
{method="get"}  0.04            //  24 / 600
{method="post"} 0.05            //   6 / 120
如果不用ignoring修改器,将得不到任何结果。
使用group_left修改器进行查询:
method_code:http_errors:rate5m / ignoring(code) group_left method:http_requests:rate5m
得到的结果是:
{method="get", code="500"}  0.04            //  24 / 600
{method="get", code="404"}  0.05            //  30 / 600
{method="post", code="500"} 0.05            //   6 / 120
{method="post", code="404"} 0.175           //  21 / 120
聚合函数
Prometheus提供非常的多的聚合函数,可以用来聚合耽搁瞬时向量,聚合完后的结果会生成根据聚合标签生成一个新的序列:
sum(calculate sum over dimensions)min(select minimum over dimensions)max(select maximum over dimensions)avg(calculate the average over dimensions)group(all values in the resulting vector are 1)stddev(calculate population standard deviation over dimensions)stdvar(calculate population standard variance over dimensions)count(count number of elements in the vector)count_values(count number of elements with the same value)bottomk(smallest k elements by sample value)topk(largest k elements by sample value)quantile(calculate φ-quantile (0 ≤ φ ≤ 1) over dimensions)
基本查询格式是:
<aggr-op> [without|by (<label list>)] ([parameter,] <vector expression>)
比如prometheus_http_requests_total这个指标有4个标签,分别是code、handler、instance、job(其中job为采集任务、instance为被采集的实例,这两个标签对于同一个实例来说基本不变), timeseries格式如下:
prometheus_http_requests_total{code="200",handler="/metrics",instance="localhost:9090",job="prometheus"}
我们可以计算所有handler、code的的请求总数:
sum by (handler, code) (prometheus_http_requests_total)
它同等于:
sum without (instance, job) (prometheus_http_requests_total)
如果想计算所有的请求的总数:
sum(prometheus_http_requests_total)
获取请求次数最多的5个请求,可以用topk函数:
topk(5,sum by (handler, code) (prometheus_http_requests_total))
其他常见的函数
计算counter的增长率
可以使用increase函数计算增量数据,比如计算最近5分钟的请求次数:
increase(prometheus_http_requests_total{code="200",handler="/metrics"}[5m])
这里使用prometheus_http_requests_total{code="200",handler="/metrics"}[5m]获取最近五分钟的样本,用increase函数算出五分钟的增量。
那么每秒的增量率,可以将上面的结果除以300,可以使用以下的表达式进行计算:
increase(prometheus_http_requests_total{code="200",handler="/metrics"}[5m])/(60*5)
除了使用increase函数计算增量外,可以使用rate函数计算速率,上面的表达式等价于:
rate(prometheus_http_requests_total{code="200",handler="/metrics"}[5m])
需要注意的是使用rate或者increase函数去计算样本的平均增长速率,容易陷入“长尾问题”当中,其无法反应在时间窗口内样本数据的突发变化。 例如,对于请求数量在5分钟的时间窗口内,可能在某一时刻访问量突增,但是通过计算在时间窗口内的平均增长率却无法反应出该问题。
为了解决该问题,PromQL提供了另外一个灵敏度更高的函数irate(v range-vector)。irate同样用于计算区间向量的计算率,但是其反应出的是瞬时增长率。irate函数是通过区间向量中最后两个样本数据来计算区间向量的增长速率。这种方式可以避免在时间窗口范围内的“长尾问题”,并且体现出更好的灵敏度,通过irate函数绘制的图标能够更好的反应样本数据的瞬时变化状态。
irate(prometheus_http_requests_total{code="200",handler="/metrics"}[5m])
预测指标变化趋势
predict_linear函数是用来基于当定的时间范围的时序来预测未来一段时间的数据,函数的格式如下:
predict_linear(v range-vector, t scalar)
例如,基于5小时的样本数据,来预测主机可用磁盘空间的是否在24个小时候被占满,可以使用如下表达式:
predict_linear(node_filesystem_free{job="node"}[5h], 24 * 3600) < 0
计算分位数
Histogram类型的指标可以使用histogram_quantile函数进行计算,函数格式为:
histogram_quantile(φ scalar, b instant-vector)
例如有以下的指标prometheus_http_request_duration_seconds_bucket
prometheus_http_request_duration_seconds_bucket{handler="/metrics",instance="localhost:9090", job="prometheus", le="0.1"}  3767

prometheus_http_request_duration_seconds_bucket{handler="/metrics",instance="localhost:9090, job="prometheus", le="0.2"}  3769

prometheus_http_request_duration_seconds_bucket{handler="/metrics",instance="localhost:9090, job="prometheus", le="0.4"} 3773

prometheus_http_request_duration_seconds_bucket{handler="/metrics",instance="localhost:9090, job="prometheus", le="1"} 3775

prometheus_http_request_duration_seconds_bucket{handler="/metrics",instance="localhost:9090, job="prometheus", le="3"} 3776

prometheus_http_request_duration_seconds_bucket{handler="/metrics",instance="localhost:9090, job="prometheus", le="8"} 3776

prometheus_http_request_duration_seconds_bucket{handler="/metrics",instance="localhost:9090, job="prometheus", le="20"} 3776

prometheus_http_request_duration_seconds_bucket{handler="/metrics",instance="localhost:9090, job="prometheus", le="60"} 3776

prometheus_http_request_duration_seconds_bucket{handler="/metrics",instance="localhost:9090, job="prometheus", le="120"} 3776


prometheus_http_request_duration_seconds_bucket{handler="/metrics",instance="localhost:9090, job="prometheus", le="Infinity"} 3776
计算handler="/metrics"接口的p90耗时:
histogram_quantile(0.9, sum by (handler,le) (rate(prometheus_http_request_duration_seconds_bucket{handler="/metrics"}[1m])))
计算p99耗时的表达式如下:
histogram_quantile(0.99, sum by (handler,le) (rate(prometheus_http_request_duration_seconds_bucket{handler="/metrics"}[1m])))
总结
本文快速的讲解了promql的查询、操作符、函数,并通过案例进行了实战。详细内容可以查看官方网站:https://prometheus.io/docs/prometheus/latest/querying/basics/
