在SpringBoot项目中使用Prometheus监控
本篇文章主要讲解如何在SpringBoot项目中使用Prometheus监控,实现方式有两种,一种是使用Springboot自带的spring-boot-starter-actuator;另一种是使用Prometheus的Java客户端
方案一:使用spring-boot-starter-actuator
SpringBoot已经有来Micrometer的指标库,它默认集成在spring-boot-starter-actuator的依赖包中(要求SpringBoot>=2.0版本)。
新建一个SpringBoot项目,在项目中引入以下的依赖:
      <dependency>
            <groupId>org.springframework.boot</groupId>
            <artifactId>spring-boot-starter-test</artifactId>
            <scope>test</scope>
        </dependency>

        <dependency>
            <groupId>org.springframework.boot</groupId>
            <artifactId>spring-boot-starter-actuator</artifactId>
        </dependency>

        <dependency>
            <groupId>io.micrometer</groupId>
            <artifactId>micrometer-registry-prometheus</artifactId>
            <version>1.11.4</version>
        </dependency>
其中micrometer-registry-prometheus依赖是将Micrometer的指标转换成prometheus格式的指标。
然后在springboot的配置文件application.properties中开启prometheus的暴露接口:
management.endpoints.web.exposure.include=prometheus
在SpringBoot项目创建一个测试接口:
@Controller
public class BasicController {

    // http://127.0.0.1:8080/hello?name=lisi
    @RequestMapping("/hello")
    @ResponseBody
    public String hello(@RequestParam(name = "name", defaultValue = "unknown user") String name) {
        return "Hello " + name;
    }

}
在浏览器上请求测试接口http://127.0.0.1:8080/hello?name=lisi
然后,在浏览器上请求http://127.0.0.1:8080/actuator/prometheus
可以得到/hello接口相关的指标,当然actuator有很多内置的指标,在这里就不展开讲解了 。
# HELP http_server_requests_seconds
# TYPE http_server_requests_seconds summary
http_server_requests_seconds_count{exception="None",method="GET",outcome="SUCCESS",status="200",uri="/hello",} 7.0
http_server_requests_seconds_sum{exception="None",method="GET",outcome="SUCCESS",status="200",uri="/hello",} 0.071374449
# HELP http_server_requests_seconds_max
# TYPE http_server_requests_seconds_max gauge
http_server_requests_seconds_max{exception="None",method="GET",outcome="SUCCESS",status="200",uri="/hello",} 0.049234863
在这里有三个指标,分别为
- http_server_requests_seconds_count 请求的总次数
- http_server_requests_seconds_sum 请求的总耗时
- http_server_requests_seconds_max 请求的最大耗时
这个内置指标对请求耗时统计不是做的很好,只能求到最大的耗时和平均耗时,如果要求分位耗时,其实是做不到。而使用Prometheus的Java客户端是可以做到分位耗时的。
方案二:使用Prometheus
Prometheus官方提供了Java客户端,用于Java程序的指标暴露。在SpringBoot项目中的pom文件引入以下的依赖:
      <dependency>
            <groupId>io.prometheus</groupId>
            <artifactId>prometheus-metrics-core</artifactId>
            <version>1.0.0</version>
        </dependency>
        <dependency>
            <groupId>io.prometheus</groupId>
            <artifactId>prometheus-metrics-instrumentation-jvm</artifactId>
            <version>1.0.0</version>
        </dependency>
        <dependency>
            <groupId>io.prometheus</groupId>
            <artifactId>prometheus-metrics-exporter-httpserver</artifactId>
            <version>1.0.0</version>
        </dependency>
其中prometheus-metrics-core包是指标的关键包;prometheus-metrics-instrumentation-jvm是用于暴露JVM相关的指标(可选);prometheus-metrics-exporter-httpserver是用于导出指标的服务(可选);
同样的,在项目中有一个测试接口,如下:
    @RequestMapping("/hello")
    @ResponseBody
    public String hello(@RequestParam(name = "name", defaultValue = "unknown user") String name) {
        return "Hello " + name;
    }
然后,需要创建两个指标,如下:
- Counter类型的http_count_total,用于统计请求的数量,包括两个标签uri(请求路径)和status(请求状态码)
- Histogram类型的http_count_seconds,用于统计请求的耗时,包括两个标签uri(请求路径)和status(请求状态码)
然后创建一个HandlerInterceptorAdapter的拦截器,用于指标数据的统计:
- 在preHandle方法中记录请求的开始时间startTime
- 在afterCompletion方法中,统计请求的次数和请求耗时,
完整的代码如下:
package io.github.forezp.prometheuslab.aop;

import io.prometheus.metrics.core.metrics.Counter;
import io.prometheus.metrics.core.metrics.Histogram;
import org.springframework.web.servlet.ModelAndView;
import org.springframework.web.servlet.handler.HandlerInterceptorAdapter;

import javax.servlet.http.HttpServletRequest;
import javax.servlet.http.HttpServletResponse;

public class ApiStatInterceptor extends HandlerInterceptorAdapter {
    Counter counter = Counter.builder()
            .name("http_count_total")
            .help("example counter")
            .labelNames("uri","status")
            .register();
    Histogram histogram = Histogram.builder()
            .name("http_count_seconds")
            .help("example counter")
            .labelNames("uri","status")
            .register();
    @Override
    public boolean preHandle(HttpServletRequest request, HttpServletResponse response, Object handler) throws Exception {
        long startTime = System.currentTimeMillis();
        request.setAttribute("startTime", startTime);
        return true;
    }

    @Override
    public void postHandle(HttpServletRequest request, HttpServletResponse response, Object handler, ModelAndView modelAndView) throws Exception {

    }

    @Override
    public void afterCompletion(HttpServletRequest request, HttpServletResponse response, Object handler, Exception ex) throws Exception {
        long startTime = (Long) request.getAttribute("startTime");
        long endTime = System.currentTimeMillis();
        String uri=request.getRequestURI();
        counter.labelValues(uri,"ok").inc();
        histogram.labelValues(uri,"ok").observe(endTime-startTime);
    }

}
然后将ApiStatInterceptor注册到WebMvcConfigurer中:
@Configuration
public class WebConfig implements WebMvcConfigurer {
    @Override
    public void addInterceptors(InterceptorRegistry registry) {
        registry.addInterceptor(new ApiStatInterceptor());
    }
}
开启HTTPServer,并已bean的形式注册:
    @Bean
    public HTTPServer createHttpServer() throws IOException {

            HTTPServer server = HTTPServer.builder()
                    .port(9400)
                    .buildAndStart();
            return server;
    }
在浏览器上请求测试接口http://127.0.0.1:8080/hello?name=lisi
然后在浏览器上访问http://localhost:9400/metrics,可以看到有两个指标http_count_total和http_count_seconds,指标数据如下:
# HELP http_count_total example counter
# TYPE http_count_total counter
http_count_total{status="ok",uri="/hello"} 2.0
# HELP http_count_seconds example counter
# TYPE http_count_seconds histogram
http_count_seconds_bucket{status="ok",uri="/hello",le="0.005"} 0
http_count_seconds_bucket{status="ok",uri="/hello",le="0.01"} 0
http_count_seconds_bucket{status="ok",uri="/hello",le="0.025"} 0
http_count_seconds_bucket{status="ok",uri="/hello",le="0.05"} 0
http_count_seconds_bucket{status="ok",uri="/hello",le="0.1"} 0
http_count_seconds_bucket{status="ok",uri="/hello",le="0.25"} 0
http_count_seconds_bucket{status="ok",uri="/hello",le="0.5"} 0
http_count_seconds_bucket{status="ok",uri="/hello",le="1.0"} 0
http_count_seconds_bucket{status="ok",uri="/hello",le="2.5"} 0
http_count_seconds_bucket{status="ok",uri="/hello",le="5.0"} 0
http_count_seconds_bucket{status="ok",uri="/hello",le="10.0"} 1
http_count_seconds_bucket{status="ok",uri="/hello",le="+Inf"} 2
http_count_seconds_count{status="ok",uri="/hello"} 2
http_count_seconds_sum{status="ok",uri="/hello"} 44.0
配置Prometheus采集
在Springboot的项目中增加springboot指标的采集,配置如下:
scrape_configs:
  - job_name: "springboot"
    static_configs:
      - targets: ["localhost:9400"]
配置完成后,重新启动prometheus或者热加载,重新加载一下配置。
配置grafana视图
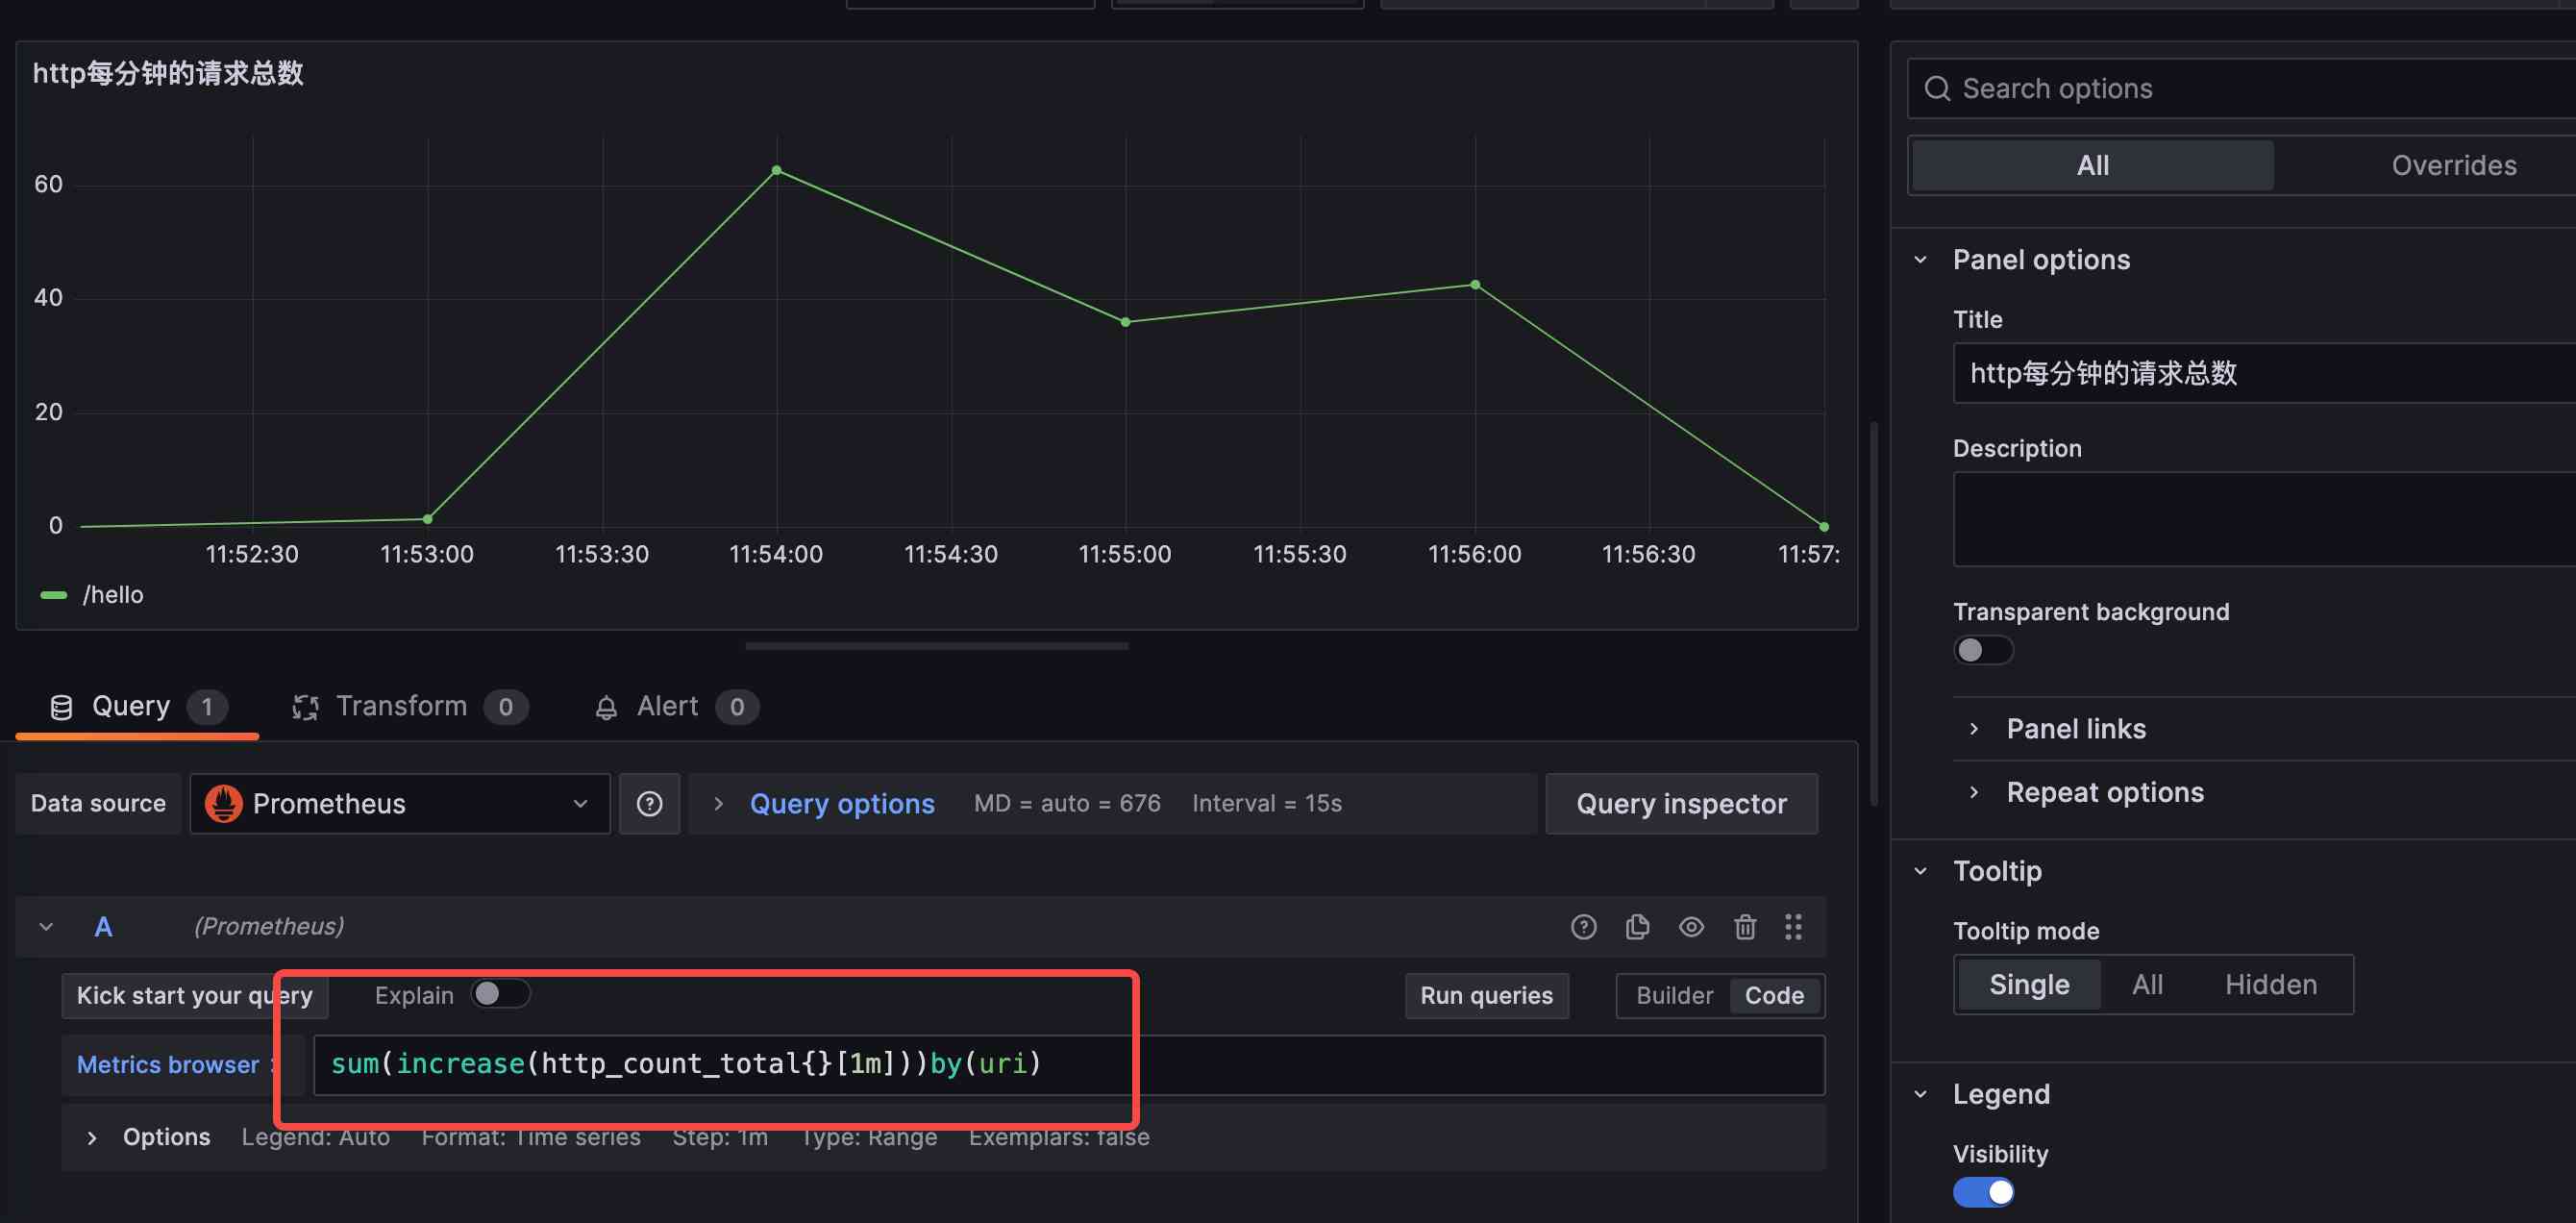
在grafana中为Springboot项目配置试图,比如配置每分钟的请求量,配置的表达式如下:
sum(increase(http_count_total{}[1m]))by (uri)
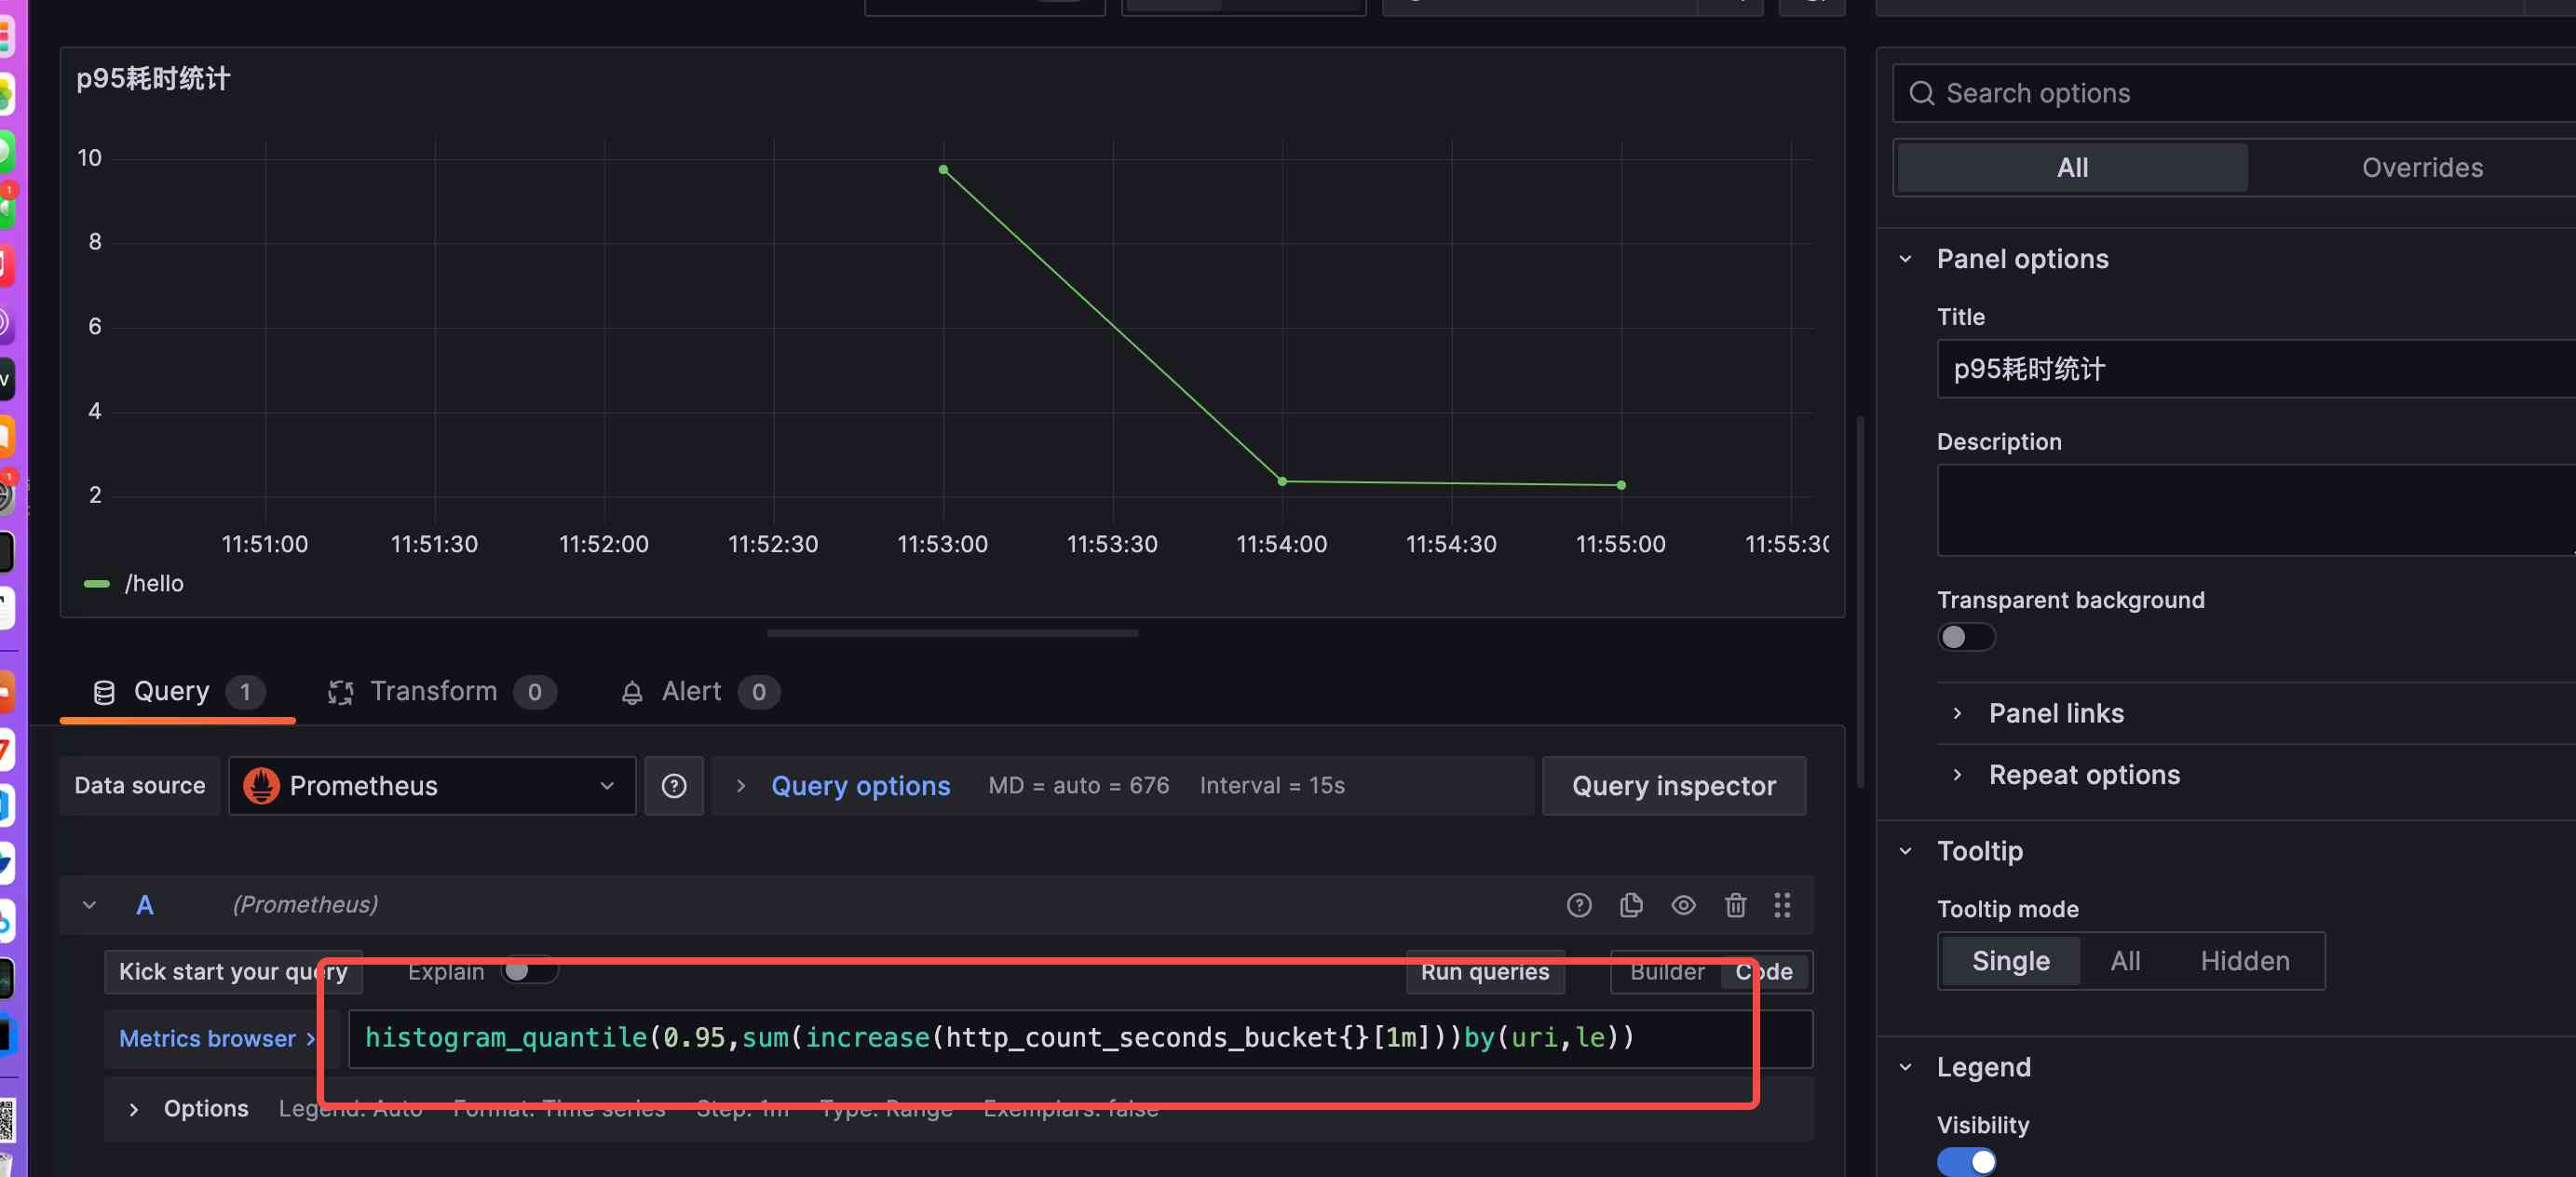
配置请求的p95耗时,配置的表达式如下:
histogram_quantile(0.95,sum(increase(http_count_seconds_bucket{}[1m]))by(uri,le))