Prometheus的数据模型
什么是time-series
Prometheus通过时间序列来存储所有的数据的。时间序列是指标(有相同指标名和标签构成的)的包含时间和值的流式数据。采用的数据模型是单值模型,且只支持浮点数指标。举个例子:
在前面的文章介绍过如下Prometheus自身的监控,通过/metrics接口暴露,Prometheus可以通过调用/metrics接口来获取自身的数据。指标定义如下:
# HELP prometheus_http_requests_total Counter of HTTP requests.
# TYPE prometheus_http_requests_total counter
prometheus_http_requests_total{code="200",handler="/metrics"} 1205
指标是单值模型,即一个指标代表一种含义,如下表示prometheus_http_requests_total{code="200",handler="/metrics"} 指标在不同时间下的值。
| 指标名称(name) | code | handler | Timestamp | Value |
|---|---|---|---|---|
| prometheus_http_requests_total | 200 | /metrics | 1696984318.82 | 1205 |
| prometheus_http_requests_total | 200 | /metrics | 1696984153.822 | 1194 |
| prometheus_http_requests_total | 200 | /metrics | 1696984033.817 | 1186 |
指标在不同时间有不同的值,被称为time-series(时间序列),time-series中每个点被称为一个样子(sample),sample由三部分组成:
- 指标:指标是由指标名和标签组成,它们共同组成描述当前指标的特征
- 指标名和标签名的命名需要满足
[a-zA-Z_:][a-zA-Z0-9_:]* - 对于标签值无约束,但是需要对值的控制字符进行转义
- 指标名和标签名的命名需要满足
- 时间戳(timestamp):时间戳精度为毫秒
- 值(value): float64类型的值。
<--------------- metric -------------------------------------><-timestamp -><-value->
prometheus_http_requests_total{code="200",handler="/metrics"}@1696984318.82 => 1205
prometheus_http_requests_total{code="200",handler="/metrics"}@1696984153.822 => 1194
prometheus_http_requests_total{code="200",handler="/metrics"}@1696984033.817 => 1186
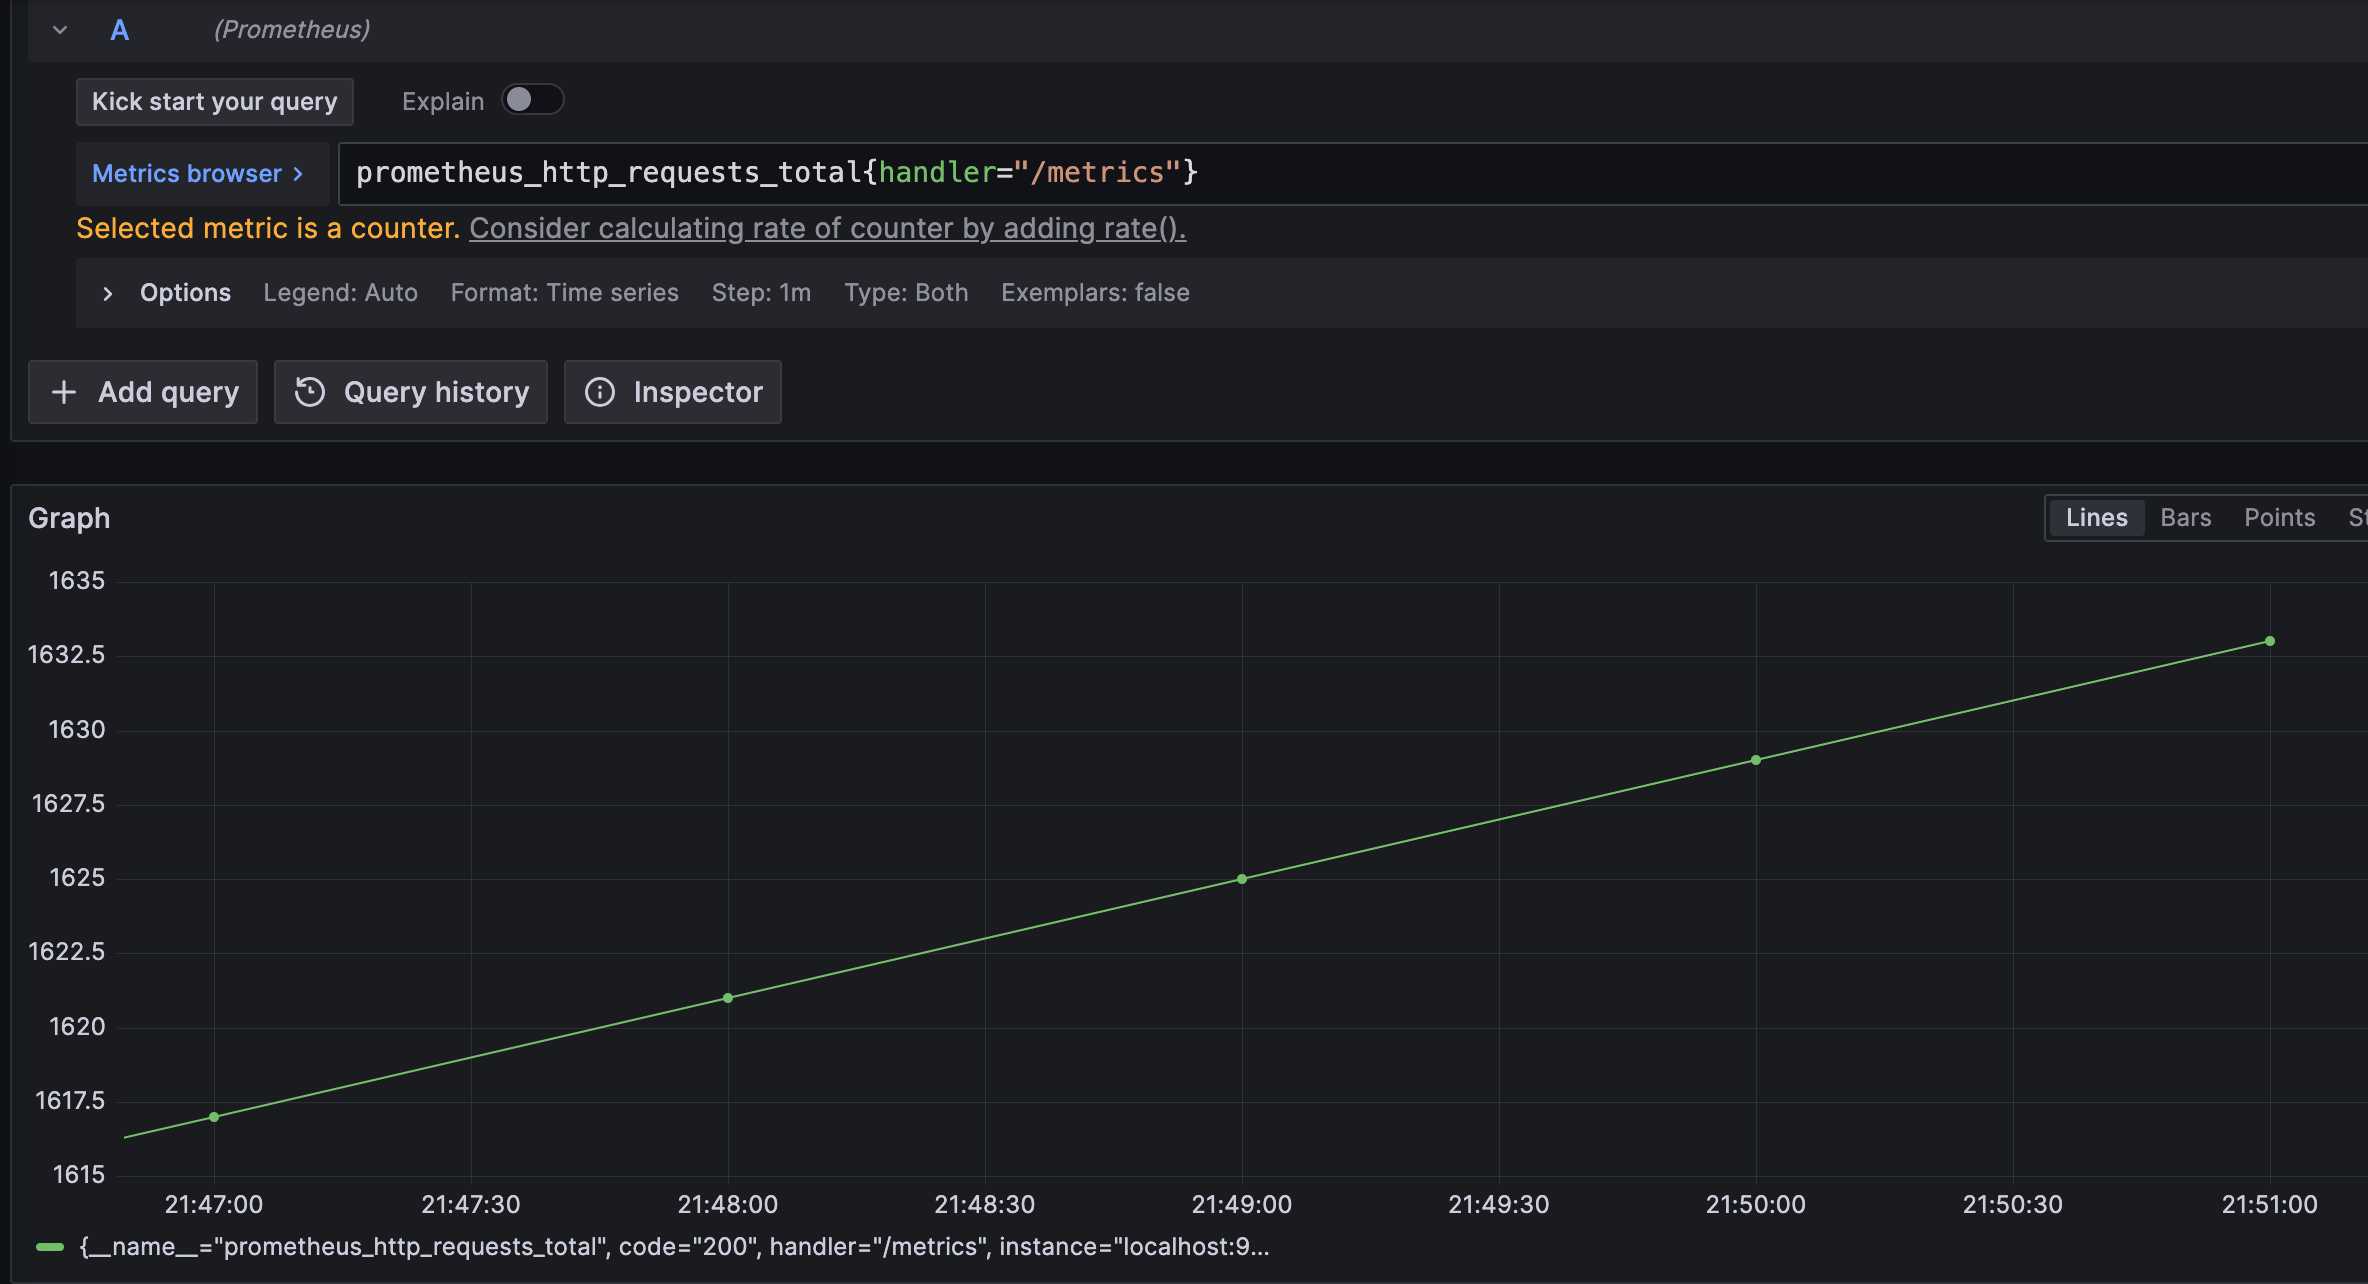
在grafana上查询指标:prometheus_http_requests_total{code="200",handler="/metrics"};
指标的类型
Prometheus定义来四种类型的指标:
- Counter(累加器),初始值为0,只增不减,或者重启的进程的时候重置为0
- Gauge(仪表盘),状态值,可增可减。
- Histogram(直方图),用于求分位数,比如p99
- Summary(摘要),和直方图类似
但是对于Prometheus的底层数据来说,这些类型的指标在存储的时候,并没有差别,都是以time-series的形式存储在Prometheus的level-db中。而在样本数据采集的时候,在注释中包含了指标的类型,其实在存储的时候是并没有存储的。
# HELP prometheus_http_requests_total Counter of HTTP requests.
# TYPE prometheus_http_requests_total counter
prometheus_http_requests_total{code="200",handler="/metrics"} 1205
Counter 累加器
Counter类型的指标和计数器一样,初始值为零,是单调递增的,除非进程重启重置。一般Counter类型的指标建议以_total结尾。例如prometheus_http_requests_total表示prometheus服务的http请求的数量,prometheus每发生一个请求,prometheus_http_requests_total都会累积1。
使用counter类型的指标,可以很容易一段时间的增量数据,比如求最近5分钟prometheus发生了多少次请求:
increase(prometheus_http_requests_total[5m])
increase是promql中的一个函数,函数的内容,在下一篇文章将会讲解。
Gauge仪表盘
Gauge类型的指标主要反映的是当前的状态,它是可增可减的,比如node exporter采集的指标中:node_filesystem_avail_bytes,表示的是当前系统文件系统中磁盘可用的字节数,可用通过prometheus的内置函数计算最近5分钟node_filesystem_avail_bytes的差值。
delta(node_filesystem_avail_bytes{}[5m])
还可以使用predict_linear函数对指标的数据变化趋势进行预测。例如,预测系统磁盘在6个小时之后的剩余情况:
predict_linear(node_filesystem_free{job="node"}[1h], 6* 3600)
Histogram直方图
Histogram直方图是用来统计和分析样本的分布情况。
在很多场景下,我们可以使用求平均值来量化指标。比如我们求某个请求耗时的平均值,但是在大多数情况下,请求都是在100ms以内,而个别情况可能导致请求耗时超过了5s,导致请求耗时的平均值远大于100ms,这个平均值是不能反应的请求的真实状态。
Histogram直方图可以解决上面的问题,例如0-10ms的请求有多少个,10ms-20ms的请求又多少个。例如prometheus的服务的/metrics接口耗时,使用了prometheus_http_request_duration_seconds_bucket指标去统计。
prometheus_http_request_duration_seconds_bucket{handler="/metrics",le="0.1"} 1827
prometheus_http_request_duration_seconds_bucket{handler="/metrics",le="0.2"} 1828
prometheus_http_request_duration_seconds_bucket{handler="/metrics",le="0.4"} 1829
prometheus_http_request_duration_seconds_bucket{handler="/metrics",le="1"} 1830
prometheus_http_request_duration_seconds_bucket{handler="/metrics",le="3"} 1831
prometheus_http_request_duration_seconds_bucket{handler="/metrics",le="8"} 1831
prometheus_http_request_duration_seconds_bucket{handler="/metrics",le="20"} 1831
prometheus_http_request_duration_seconds_bucket{handler="/metrics",le="60"} 1831
prometheus_http_request_duration_seconds_bucket{handler="/metrics",le="120"} 1831
prometheus_http_request_duration_seconds_bucket{handler="/metrics",le="+Inf"} 1831
在上面的示例中,使用le标签表示小于的意思。
- le="0.1" 表示小于0.1s,有1827个请求
- le="0.2"表示小于0.2s,有1828个请求
通过这种直方图可以很方便的统计请求耗时分布的真实状态。另外,会统计当前指标的记录总数(以_count作为后缀)和值的总和(以_sum作为后缀),例如:
prometheus_http_request_duration_seconds_sum{handler="/metrics"} 15.171390910999984
prometheus_http_request_duration_seconds_count{handler="/metrics"} 1831
Histogram的指标,我们还可以通过histogram_quantile()函数计算出其值的分位数。
summary
summary和Histogram类似,只不过summary是已经在客户端已经计算好的数据,例如go_gc_duration_seconds指标:
# HELP go_gc_duration_seconds A summary of the pause duration of garbage collection cycles.
# TYPE go_gc_duration_seconds summary
go_gc_duration_seconds{quantile="0"} 6.3884e-05
go_gc_duration_seconds{quantile="0.25"} 0.00013637
go_gc_duration_seconds{quantile="0.5"} 0.000194843
go_gc_duration_seconds{quantile="0.75"} 0.000421166
go_gc_duration_seconds{quantile="1"} 0.009242327
go_gc_duration_seconds_sum 0.1255515
go_gc_duration_seconds_count 296
Histogram和summary的区别在于,summary是在sdk侧已经计算好了分位数,而Histogram是通过histogram_quantile函数在prometheus-server进行计算的。对于分位数的计算而言,Summary在通过PromQL进行查询时有更好的性能表现,而Histogram则会消耗更多服务端的的资源。
通常情况下,我们都会选择使用Histogram类型的指标去做分位数的统计,而不是使用summary。
